Western Pennsylvania
Northwestern West Virginia
Maps: Exploration, Resources, Reserves, and Production |
|---|
|
|||||||||||||||||||||
| Oil- and gas-related maps, geospatial data, and geospatial software |
| Maps in Portable Document Format (.pdf) |
|
The following maps were developed using GIS software and then converted to pdf format. You must therefore have the Adobe Reader® browser plugin installed to view them (free download available at Adobe Acrobat Reader). Most of the maps are large format (60 inches X 36 inches, for example) because they were intended for printing on a wide-bed printer. To clearly view them on your monitor you will have to zoom in and then scroll through the map. They will also take more than just a couple of seconds to load owing to their complexity. |
| United States coalbed methane maps |
| Panel 1: Coalbed methane status map |
| Panel 2: Coalbed Methane Past, Present, and Future |
| United States shale oil and natural gas maps |
| The following map panels show the drilling history and the natural gas proved reserves, production, and proved ultimate recovery histories of selected low-permeability, self-sourced, continuous-type shale reservoirs. Selected geologic characteristics pertinent to occurrence of producible gas resources in the reservoir are also shown when available. |
| Lower 48 states shale plays (4/13/2015) |
| Barnett Shale, Ft. Worth Basin, Texas |
| Barnett Shale, Ft. Worth Basin, Texas (letter-size) (6/1/2011) |
| Eagle Ford Play updates (12/29/2014) |
| Eagle Ford Shale Play, Western Gulf Basin, South Texas (12/29/2014) |
| Fayetteville Shale, Arkoma Basin, Arkansas |
| Fayetteville Shale, Arkoma Basin, Arkansas (letter-size) (6/1/2011) |
| Haynesville-Bossier Shale Play, Texas-Louisiana Salt Basin (6/1/2011) |
| Marcellus Play updates (2/8/2015), related article — Updated geologic maps provide greater detail for Marcellus formation, Today in Energy, 4/1/15 |
| Marcellus Shale Play, Appalachian Basin (6/1/2011) |
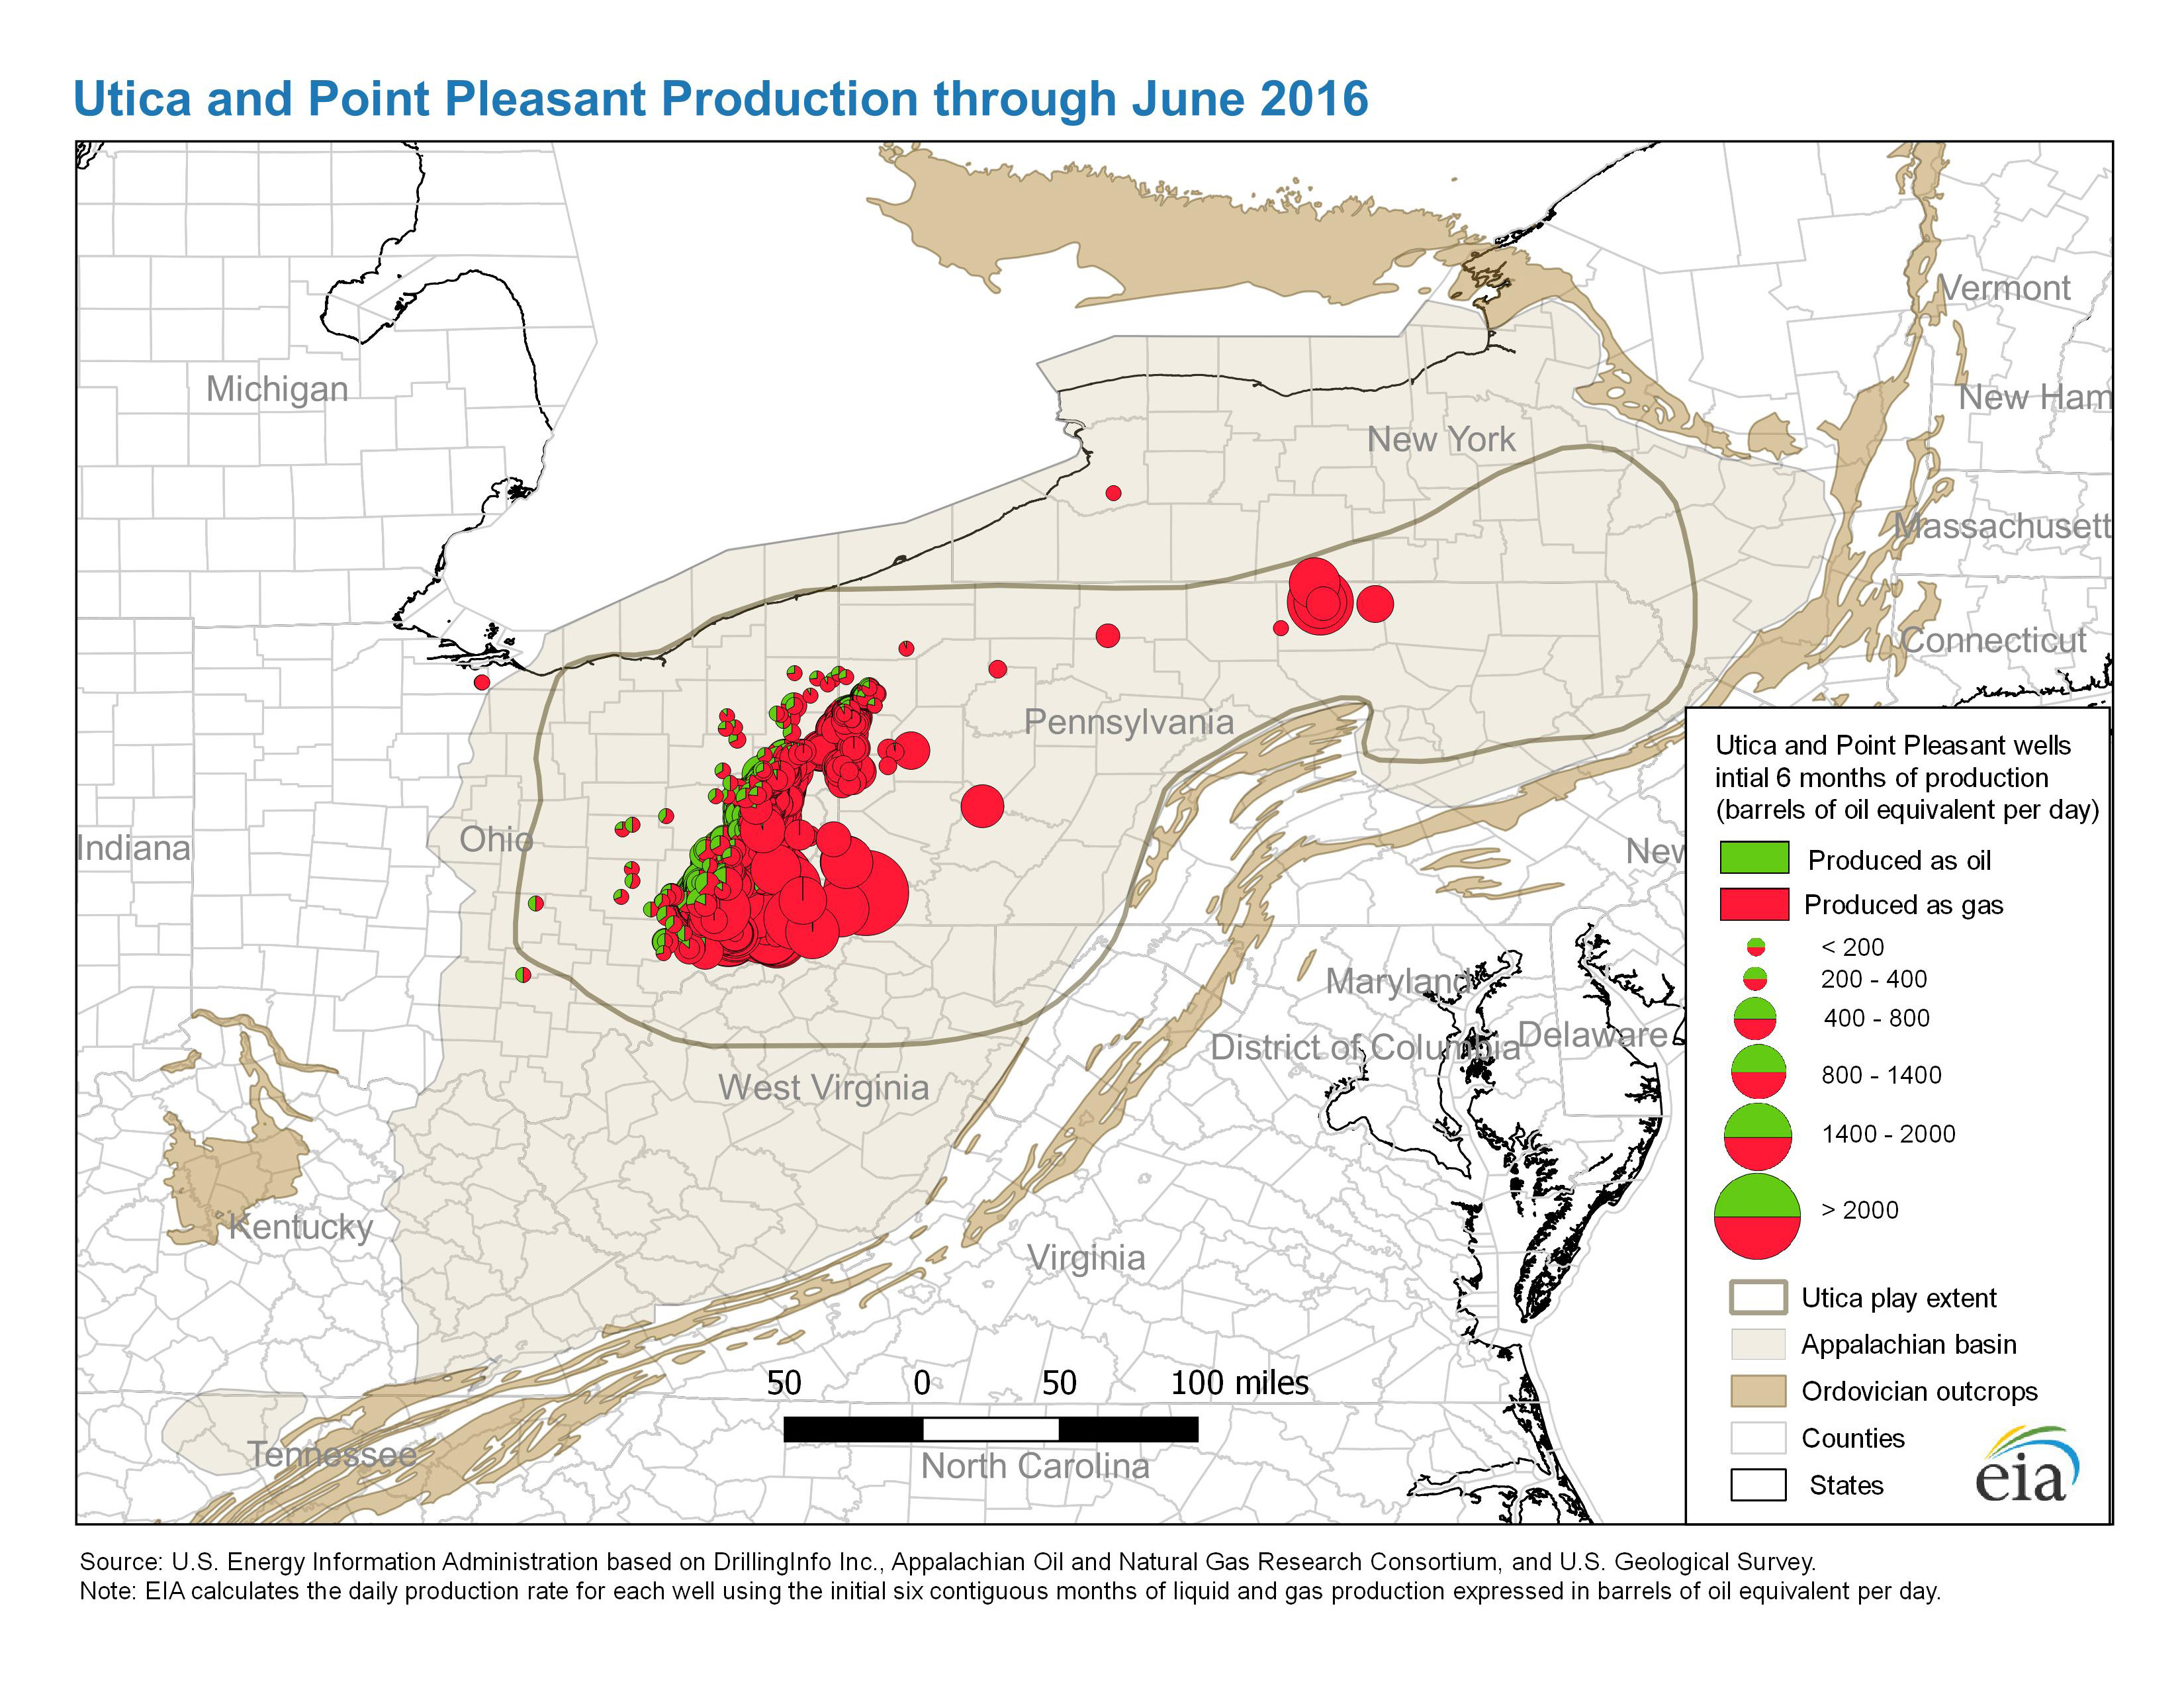
Utica Play, Appalachian Basin
|
| Woodford Shale Play, Arkoma Basin, Oklahoma (6/1/2011) |
| Woodford Shale Play, Anadarko Basin, Oklahoma and Texas (6/1/2011) |
| Woodford Shale Play, Ardmore Basin, Oklahoma and Texas (6/1/2011) |
United States tight gas maps |
| Granite Wash Play, Texas and Oklahoma |
United States shale oil maps |
| Bakken Shale Play, Williston Basin, North Dakota, Montana, Saskatchewan & Manitoba (3/20/2011) |
Shale play development history animations |
| Barnett Shale Drilling from 1981 to 2010 (6/1/2011) |
| Bakken Shale Production from 1985 to 2010 (9/30/2011) |
| Eagle Ford Shale Production from 2006 to 2010 (9/30/2011) |
United States oil and gas field maps |
| The following national map portrays the location of fields identified as being among the 100 largest oil and/or 100 largest gas fields in the United States on December 31, 2009, per EIA's U.S. Crude Oil, Natural Gas, and Natural Gas Liquids Proved Reserves, 2009. |
| The 100 Volumetrically Largest U.S. Oil and Gas Fields |
| The following letter size maps portray the same information by product. |
| Top 100 U.S. Oil Fields By 2009 Proved Reserves |
| Top 100 U.S. Gas Fields By 2009 Proved Reserves |
Detailed oil and gas field maps |
| The detailed field maps linked below portray the locations, boundaries, names, and either the barrel-of-oil equivalent (BOE) or the liquid hydrocarbon (crude oil plus lease condensate) or the natural gas reserve size classes of the known oil and gas fields in selected geologically defined areas of the U.S. at year-end 2001. Multiple map sheets were required to adequately portray the fields of some areas. Use this
Index of Detailed Field Maps to identify which of the subsequently listed oil and gas field maps you might be interested in viewing. Pursuant to Section 604 of the Energy Policy and Conservation Act, these maps are one product of a joint Department of the Interior, Department of Energy, and Department of Agriculture study of access to oil and gas resources located on Federal onshore lands. The maps conform to that ongoing study's temporal, areal, and technical requirements.
|
| Area | BOE | Liquids | Gas |
|---|---|---|---|
| Appalachian Basin: | |||
| Western New York | |||
| Northern Ohio, Southwestern New York, and Western Pennsylvania |
|||
| Eastern Pennsylvania | |||
| Southern Ohio, Southwestern Pennsylvania, and Northwestern West Virginia |
|||
| Eastern West Virginia and Western Maryland | |||
| Southern West Virginia and Southwestern Virginia | |||
| Kentucky and Tennessee | |||
| Black Warrior Basin | |||
| South Florida Peninsula | |||
| Alaska's Cook Inlet | |||
| Alaskan North Slope | |||
| National Petroleum Reserve-Alaska and Arctic National Wildlife Refuge 1002 Area | |||
| Eastern Oregon and Washington | |||
| Ventura Basin: | |||
| East Part | |||
| West and Central Parts | |||
| Montana Thrust Belt | |||
| Williston Basin: | |||
| Northeast Part | |||
| Northwest Part | |||
| South Part | |||
| Wyoming Thrust Belt | |||
| Eastern Great Basin | |||
| Powder River Basin: | |||
| Northern Part | |||
| Southern Part | |||
| Greater Green River Basin | |||
| Uinta-Piceance Basin | |||
| Paradox-San Juan Basin: | |||
| Northwest Part | |||
| Southeast Part | |||
| Denver Basin: | |||
| Northern Part | |||
| Middle Part | |||
| South Part |
Geospatial Data in Shapefile (.shp) Format |
| Compatible GIS software is required to read, render, and manipulate the data content of the following files that provide the identification, location, boundary, size class, and other EIA-sourced information used to generate the detailed field maps linked above. The files are provided in compressed format (.zip) sets. |
|
Users of WinZip® are advised that a default setting must be changed in the WinZip compression utility (any version) to avoid corruption of the GIS files while they are being unzipped. The following change only affects unzipping: 1) Open WinZip Classic. 2) Select Options > Configuration > Miscellaneous tab. 3) Uncheck the 'TAR file smart CR/LF conversion' box. It will remain unchecked until you check it again. 4) Select OK. |
Data for the coalbed methane panels |
| Shapefiles for field boundaries (2007), resources (2006), reserves and production (2006), and the top 100 methane emitting coal mines (2005). |
Data for the US Low Permeability Oil and Gas Plays Maps |
| Shapefile for low permeability oil and gas play boundaries in Lower 48 States (3/11/2016) |
| Shapefile for sedimentary basin boundaries in Lower 48 States (3/11/2016) |
| Shapefiles for Abo-Yeso, Bone Spring, Delaware, Glorieta-Yeso, and Spraberry play boundaries (3/11/2016) |
| Shapefiles for Bakken and Three Forks play boundaries, structure and isopachs (3/11/2016) |
| Shapefiles for Eagle Ford play boundaries, structure and isopachs (3/11/2016) |
| Shapefiles for Marcellus play boundaries, structure and isopachs (3/11/2016) |
| Shapefiles for Niobrara play boundaries, structure and isopachs (3/11/2016) |
| Shapefiles for Utica play: play boundaries, structure and Isopach for Utica and Point Pleasant formations (5/6/2016) |
| Shapefiles for Utica play: Major structural and tectonic features (5/9/2016) |
Data for the Tight Gas Plays Map |
| Shapefiles for basin and play boundaries |
Data for the Detailed Oil and Gas Field Maps |
| Shapefile for the Powder River, Greater Green River, Uinta-Piceance, and Paradox-San Juan Basins plus Shapefile for the Montana Thrust Belt |
| Shapefile for the Appalachian Basin |
| Shapefiles for the Black Warrior Basin, Denver Basin, Wyoming Thrust Belt, National Petroleum Reserve-Alaska plus the Arctic National Wildlife Refuge 1002 Area, and the South Florida Peninsula |
| Shapefiles for the Eastern Great Basin, Eastern Oregon and Washington, Alaskan North Slope, Alaska's Cook Inlet, Ventura Basin, and Williston Basin |
EIA's oil and gas field Boundary Generation Scripts |
| The following Word® (.doc) files provide and describe three script codes conceived, developed, and implemented by EIA to (a) automatically and efficiently generate geologically reasonable oil and gas field boundaries from well data, and then (b) calculate the percentage of Federal land within the each field's boundary. The scripts are coded in Visual Basic® for use in conjunction with ArcGIS® software. |
| Well Buffering Script |
| Field Outline Smoothing Script | Tool (6/1/2011 for ArcGIS 10.0 |
| Federal Land Percentage Calculation Script |
| Application of the decision procedure specified in the Federal Geographic Data Committee's Guidelines for Providing Appropriate Access to Geospatial Data in Response to Security Concerns to the geospatial data provided via this web page resulted in a finding that safeguarding of these data is unwarranted. |
| Adobe Reader is a trademark of Adobe Systems Incorporated; Word and Visual Basic are trademarks of Microsoft Corporation; ArcGIS is a trademark of ESRI, Inc.; WinZip is a trademark of WinZip International LLC. |