
A Warming World
Global land and ocean surface temperature are considered remarkably high, with limited areas experiencing near- to cooler-than-average conditions. Depending on the data set considered, the year ranked as the second or third highest since records began in the mid-to-late 1800s, at 0.38 to 0.48 degrees Celsius above the 1981 to 2010 average.
Shrinking Glaciers
Preliminary data indicate that glaciers across the world continued to lose mass for the 38th consecutive year on record; the declines are remarkably consistent from region to region. Cumulatively since 1980, this loss is the equivalent of slicing 22 meters (over 72 feet) off the top of the average glacier.
Higher Ocean Temperatures
The last three years have been the three highest annual values for sea surface temperature observed. 2017 sea surface temperature was 0.2 to 0.5 degrees Celsius higher than 2016 in the central-to-southwestern North Pacific, central South Pacific, eastern North Atlantic, Chukchi Sea of the Arctic, western Indian Ocean, and much of the Southern Ocean.

Warmer Lakes, Too
Global lake surface water temperatures were the second highest since 1995 (the earliest satellite data used), behind only 2016. Eight of the 10 warmest years for lake surface waters in the record have occurred since 2007 (1998 and 2001 rank fifth and ninth, respectively).
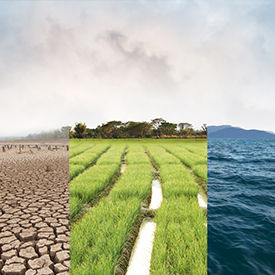
Widespread Droughts
Extensive severe or extreme droughts affected all continents except North America during 2017.
Higher Seas Equal Increased Flooding
Ongoing changes in sea level impact coastal communities by increasing the magnitude and frequency of sea level extremes that cause flooding and erosion. In many areas, coastal infrastructure is currently exposed to minor-impact flooding when water levels exceed a certain threshold. These thresholds vary geographically, but are expected to be exceeded, on average, three to four times per year.
*About the report: State of the Climate is an international, peer-reviewed report based on contributions from scientists from around the world. It is compiled by NOAA’s Center for Weather and Climate and published every year by the American Meteorological Society. This authoritative publication documents the status and trajectory of the world’s climate system and the contributors’ capacity and commitment to observe it.