
Unified Interior Regions
Region 12: Pacific Islands (American Samoa, Hawaii, Guam, Commonwealth of the Northern Mariana Islands)
Regions L2 Landing Page Tabs
Our scientists in the Pacific Islands Region conduct impartial, multi- and interdisciplinary research and monitoring on a large range of natural-resource issues that impact the quality of life of citizens of Hawaii and the Pacific Islands.
News

ICYMI Bulletin: Community Voices: New Volcano Monitors Increase Safety
Originally Published by: The Daily News
By: U.S. Geological Survey Director James Reilly
This article has been reprinted or reproduced with the permission of the The Daily News in Longview WA.

USGS Science to Keep Us Safe: Floods and Drought
The scarcity or overabundance of water presents some of the most dangerous, damaging and costly threats to human life, ecosystems and property in the form of drought, floods and debris flows.
")
Understanding Your Community’s Volcano Hazard Risk is One Way to Plan During National Preparedness Month
Disasters and emergencies can happen at any time, often without warning. Natural hazards threaten thousands of lives and cause billions of dollars in damage every year throughout the nation.

Low-lying areas of tropical Pacific islands
Sea level is rising faster than projected in the western Pacific, so understanding how wave-driven coastal flooding will affect inhabited, low-lying islands—most notably, the familiar ring-shaped atolls—as well as the low-elevation areas of high islands in the Pacific Ocean, is critical for decision-makers in protecting infrastructure or relocating resources and people.

Sea-Level Rise and Climate Change Impacts to Reefs
This study is part of the USGS Coral Reef Project.

Regional Science Portal
Welcome to the Regional Science Portal. On this site, you will find the scientific research, data, and information USGS has completed for this Region. For a geospatial view of the projects, please click the map to the right to see a larger interactive view to the areas USGS has studied in detail. Each of the tabs below lists all of the completed product offerings the USGS has completed for the...
 - Black (TM)")
U.S. Seismic Hazard Maps – Puerto Rico and the U.S. Virgin Islands, Samoa and the Pacific Islands, and Guam and Northern Mariana Islands
Seismic hazard maps for Puerto Rico and the U.S. Virgin Islands, Samoa and the Pacific Islands, and Guam.

Circulation and Sediment, Nutrient, Contaminant, and Larval Dynamics on Reefs
This study is part of the USGS Coral Reef Project.

Coral Reef Project: Guam
As part of the USGS Coral Reef Project, the USGS is working on the west coast of Guam to help determine the effects of sedimentation in nearshore waters.

United States Assessments of Undiscovered Oil and Gas Resources
USGS Energy Resources Program provides periodic assessments of the oil and natural gas endowment of the United States and the World. This website provides access to new, prioritized, assessment results and supporting data for the United States, as part of the Energy Policy and Conservation Act (EPCA).
")
The Nonindigenous Aquatic Species Alert Risk Mapper (ARM)
The Nonindigenous Aquatic Species (NAS) program has developed a new tool, the NAS Alert Risk Mapper (ARM), to characterize waterbodies in the conterminous U.S. and Hawaii at potential risk of invasion from a new nonindigenous species sighting.

The Nonindigenous Aquatic Species Flood and Storm Tracker (FaST)
Storm-related flooding can lead to the potential spread of nonindigenous (or non-native) aquatic species into waterways they have not been seen in before. The USGS Nonindigenous Aquatic Species program has developed an innovative mapping tool to help natural resource managers with post-storm nonindigenous aquatic species detection and assessment efforts.

Thermal Imaging Camera Use: Identifying Groundwater Inputs to a Reef in American Samoa
USGS scientists used a thermal camera in American Samoa to understand the effect of land-based contaminants on an adjacent coral reef lagoon ecosystem. The infrared (IR) camera was used to capture thermal images of the lagoon to look for temperature differences to understand the distribution of freshwater entering the lagoon and the circulation of the lagoon water at various tidal levels.

Risk Analysis of Invasive Freshwater Fishes in Hawaii and Micronesia
Invasive species threaten biodiversity around the world, especially on islands. USGS scientists are helping to identify fish species that have the greatest potential to invade the fresh waters of Microneisa.

Coastal and Marine Geoscience Data System
Information about scientific data collected through field activities conducted by scientists in the USGS Coastal and Marine Hazards and Resources program

National Water Information System (NWIS) Mapper
The NWIS mapper provides access to over 1.5 million sites contained in the USGS National Water Information System (NWIS), including sites where current and historical surface-water, groundwater, springs, and atmospheric data has been collected. Users can search by site type, data type, site number, or place.
Projected flood extent polygons and flood depth points based on 10-, 50-, 100-, and 500-year wave-energy return periods, with and without coral reefs, for the Commonwealth of the Northern Mariana Islands (the islands of Saipan and Tinian)
This part of the data release presents projected flooding extent polygon (flood masks) and flooding depth points (flood points) shapefiles based on wave-driven total water levels for Commonwealth of the Northern Mariana Islands (the islands of Saipan and Tinian). For each island there are 8 associated flood mask and flood depth shapefiles: one for each of four nearshore wave energy
Projected flood extent polygons and flood depth points based on 10-, 50-, 100-, and 500-year wave-energy return periods, with and without coral reefs, for American Samoa (the islands of Tutuila, Ofu-Olosega, and Tau)
This part of the data release presents projected flooding extent polygon (flood masks) and flooding depth points (flood points) shapefiles based on wave-driven total water levels for American Samoa (the islands of Tutuila, Ofu-Olosega, and Tau). For each island there are 8 associated flood mask and flood depth shapefiles: one for each of four nearshore wave energy return periods
Projected flood extent polygons and flood depth points based on 10-, 50-, 100-, and 500-year wave-energy return periods, with and without coral reefs, for the State of Hawaii (the islands of Hawaii, Kahoolawe, Kauai, Lanai, Maui, Molokai, Niihau, and Oahu
This part of the data release presents projected flooding extent polygon (flood masks) and flooding depth points (flood points) shapefiles based on wave-driven total water levels for the State of Hawaii (the islands of Hawaii, Kahoolawe, Kauai, Lanai, Maui, Molokai, Niihau, and Oahu). For each island there are 8 associated flood mask and flood depth shapefiles: one for
Projected flood extent polygons and flood depth points based on 10-, 50-, 100-, and 500-year wave-energy return periods, with and without coral reefs, for the Territory of Puerto Rico (the islands of Culebra, Puerto Rico, and Vieques)
This part of the data release presents projected flooding extent polygon (flood masks) and flooding depth points (flood points) shapefiles based on wave-driven total water levels for the Territory of Puerto Rico (the islands of Culebra, Puerto Rico, and Vieques). For each island there are 8 associated flood mask and flood depth shapefiles: one for each four nearshore wave energy
Projected flood extent polygons and flood depth points based on 10-, 50-, 100-, and 500-year wave-energy return periods, with and without coral reefs, for the Territory of Guam
This part of the data release presents projected flooding extent polygon (flood masks) and flooding depth points (flood points) shapefiles based on wave-driven total water levels for the Territory of Guam. There are 8 associated flood mask and flood depth shapefiles: one for each of four nearshore wave energy return periods (rp; 10-, 50-, 100-, and 500-years) and both with %

Projected flooding extents and depths based on 10-, 50-, 100-, and 500-year wave-energy return periods, with and without coral reefs, for the States of Hawaii and Florida, the Territories of Guam, American Samoa, Puerto Rico, and the U.S. Virgin Islands,
This data release provides flooding extent polygons (flood masks) and depth values (flood points) based on wave-driven total water levels for 22 locations within the States of Hawaii and Florida, the Territories of Guam, American Samoa, Puerto Rico, and the U.S. Virgin Islands, and the Commonwealth of the Northern Mariana Islands. For each of the 22 locations there are eight ass
Pedestrian tsunami evacuation results for two tsunami-inundation zones (2009 and probable maximum tsunami (PMT)) and four travel speeds (slow walk, fast walk, slow run, and fast run) for American Samoa
This data release is comprised of a set of eight time travel map shapefiles (two tsunami inundation zones and four travel times) for use in GIS software applications and two population exposure by travel time tables (residents and nonresidences) for use in GIS software applications and other standalone spreadsheet applications. The travel time map was generated using the Pedestrian Evacu
Pedestrian evacuation times for residents on the islands of American Samoa, for 2009 and predicted maximum tsunami (PMT) inundation zones by village, modeled at four travel speeds (slow walk, fast walk, slow run, and fast run)
This dataset contains American Samoa resident count estimates as a function of travel time out of the 2009 and probable maximum tsunami (PMT) inundation zones for four different travel speeds (slow walk, fast walk, slow run, and fast run). The data are organized in a manner which permits summarizing or visualizing the data by village, tsunami-evacuation zone, and/or travel tim
Pedestrian evacuation times for businesses on the islands of American Samoa, for 2009 and predicted maximum tsunami (PMT) inundation zones by village, modeled at four travel speeds (slow walk, fast walk, slow run, and fast run)
This dataset contains American Samoa nonresidence count estimates as a function of travel time out of the 2009 and probable maximum tsunami (PMT) inundation zones for four different travel speeds (slow walk, fast walk, slow run, and fast run). The data are organized in a manner which permits summarizing or visualizing the data by business classification (church, community center
Tsunami evacuation time map for American Samoa predicted maximum tsunami (PMT) inundation zone and fast walk speed
The travel time map was generated using the Pedestrian Evacuation Analyst model (version 1.0.1 for ArcGIS 10.5) from the USGS (https://geography.wr.usgs.gov/science/vulnerability/tools.html). The travel time analysis uses ESRI's Path Distance tool to find the shortest distance across a cost surface from any point in...
This map shows the provinces assessed by the USGS for undiscovered oil and gas resources.

The 3DEP products and services available through The National Map consist of standard digital elevation models (DEMs) at various horizontal resolutions, elevation source and associated datasets, an elevation point query service and bulk point query service. All 3DEP products are available, free of charge and without use restrictions.

A geologists makes observations at Kilauea
Clear weather allowed HVO geologists to make observations and take measurements of the water pond at Kīlauea's summit. No major changes were observed, and the water level continues to slowly rise. Note the former HVO observation tower can be seen above the geologist's helmet.

Unoccupied Aircraft System with water sampler
The sampling mechanism (on blue tarp) is prepared and the Unoccupied Aircraft System (UAS) is inspected just before take off to collect water from the Halema‘uma‘u crater lake. Brightly colored flagging tape tied to a cable attached to the UAS indicated depth as the sampling tool was lowered into the water.
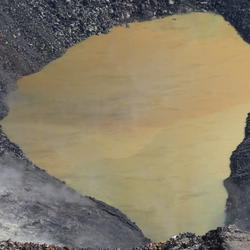
A close-up view of the Kilauea pond
A close-up view of the Kilauea pond shows the color variations across the surface, and sharp boundaries among zones of different color.

Scientists process volcano lake water samples
After a sample was collected, HVO team members transferred water from the sampling device to plastic bottles. Team members took notes, measured water pH and evaluated water temperature data for each sample collected.
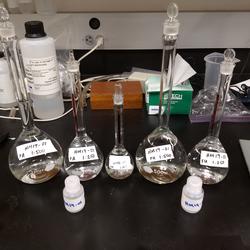
Water collected from the lake at the bottom of Halema‘uma‘u
Water collected from the lake at the bottom of Halema‘uma‘u is prepared for laboratory analyses at the USGS California Volcano Observatory. Results thus far reveal chemistry indicative of complex reactions among the water, magmatic gases and Kīlauea's basaltic rocks.
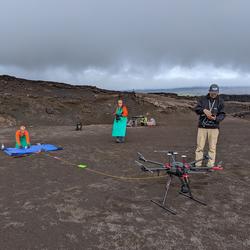
Unoccupied Aircraft System is inspected by pilot just before take off
The sampling mechanism (on blue tarp) is prepared and the Unoccupied Aircraft System (UAS) is inspected just before take off to collect water from the Halema‘uma‘u crater lake. Brightly colored flagging tape tied to a cable attached to the UAS indicated depth as the sampling tool was lowered into the water.
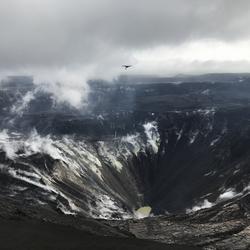
Unoccupied Aircraft System returning with a water sample.
USGS-HVO scientists and DOI UAS team members collect samples of water from the Halema‘uma‘u crater lake.

Resilience Potential of Coral Reefs in the Mariana Islands
This webinar was conducted as part of the "Climate Change Science and Management Webinar Series" held in partnership between the USGS National Climate Change and Wildlife Science Center and the FWS National Conservation Training Center. Webinar Summary: Reducing coral reef vulnerability to climate change requires that managers understand and support the natural resilience
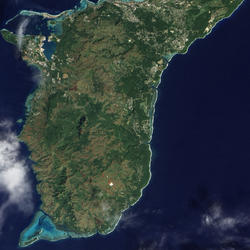
Guam satellite image
Satellite photo of Guam from NASA’s Earth Observing-1 (EO-1) satellite's Advanced Land Imager.
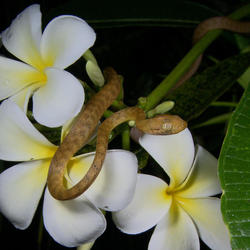
A brown treesnake on frangipangi blossoms
A brown treesnake crawls on some frangipangi blossoms in Guam.

A brown treesnake in a tree in Guam.
This is an image of a brown treesnake in a tree in Guam, taken in 2009.
Originally Published by: The Daily News
By: U.S. Geological Survey Director James Reilly
This article has been reprinted or reproduced with the permission of the The Daily News in Longview WA.
The scarcity or overabundance of water presents some of the most dangerous, damaging and costly threats to human life, ecosystems and property in the form of drought, floods and debris flows.
Disasters and emergencies can happen at any time, often without warning. Natural hazards threaten thousands of lives and cause billions of dollars in damage every year throughout the nation.

New Study Finds the Restoration of Forests with Active Rapid ʻŌhiʻa Death Infections May Be Possible
Hilo, Hawaiʻi – For the first time, researchers have shown that native ʻōhiʻa seedlings can survive for at least a year in areas that have active mortality from Rapid ʻŌhiʻa Death, or ROD, a fungal disease that is devastating to this dominant and culturally important tree in Hawaiian forests. This information can be useful to land managers and homeowners as they prioritize conservation actions.

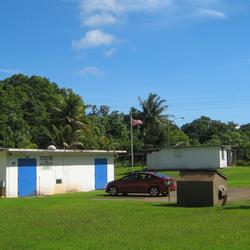
On May 14, Director Reilly signed a Memorandum of Agreement with the Department of the Navy and the U.S. Fish and Wildlife Service. The MOA provides for continuity of operations for the USFWS and the USGS with construction of new office and lab facilities on the Guam National Wildlife Refuge in conjunction with DOD’s construction of a Marine Corps firing range.
U.S. Geological Survey field crews are measuring flooding across the country as spring weather is in full swing. Warming temperatures, increased precipitation and snowmelt have caused moderate to major flooding in the upper Midwest, East Coast, Central Plains and the Southeast portions of the country.

This month marks the second anniversary of the largest rift zone eruption and summit collapse at Kīlauea Volcano in 200 years. In 2018, scientists at the U.S. Geological Survey Hawaii Volcano Observatory monitored more than 60 collapse events at the summit that caused the floor of Halema‘uma‘u crater to drop about 1600 feet, or more than five times the height of the Statue of Liberty.

Budget Focuses on Bringing Science, Facilities, and Infrastructure into the 21st Century

Research by the USGS and Dickinson College reveals why scientists fail to detect brown treesnakes at low densities

First-of-its-kind survey shows that algal toxins are found nationwide

Two recent reports of two brown treesnakes on Saipan is prompting federal and state officials to urge citizens of Hawaii, Guam and other Pacific Islands to report any sightings of these invasive snakes to authorities. Snakes can be reported by calling (671) 777-HISS or (670) 28-SNAKE.
A newly published, three-volume “Remote Sensing Handbook” is a comprehensive coverage of all remote sensing topics written by over 300 leading global experts.
Contacts
Locations


Pacific Islands Water Science Center
Phone: 808-690-9600
Fax: 808-690-9599

Pacific Island Ecosystems Research Center
Phone: (808) 985-6420
Fax: (808) 967-8568

Pacific Islands Climate Adaptation Science Center
USGS Brown Treesnake Laboratory and Rapid Response Facility
Phone: 671-637-7834