 Official website of the Department of Homeland Security


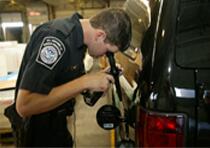


U.S. Customs and Border Protection is the nation’s largest federal law enforcement agency charged with securing the nation’s borders and facilitating international travel and trade. Our top priority is to keep terrorists and their weapons from entering the United States.
At the nation’s more than 300 ports of entry, CBP officers have a complex mission with broad law enforcement authorities tied to screening all foreign visitors, returning American citizens and imported cargo that enters the U.S. Along the nation’s borders, the United States Border Patrol and Air and Marine Operations are the uniformed law enforcement arms of CBP responsible for securing U.S. borders between ports of entry.
The following is a summary of CBP enforcement actions related to inadmissibles, apprehensions, arrests of individuals with criminal convictions and individuals who have been apprehended multiple times crossing the border illegally.
Visit CBP's Southwest Border Migration page for demographic information regarding apprehensions and inadmissibles on the southwest border and the Assaults and Use of Force page for data on assaults on agents and officers, and uses of force by CBP personnel.
Total CBP Enforcement Actions
Numbers below reflect Fiscal Year (FY) 2017 - FY 2021 to date (TD).
Fiscal Year 2021 runs October 01, 2020 - September 30, 2021.
| FY17 | FY18 | FY19 | FY20 | FY21 TD NOV | |
|---|---|---|---|---|---|
| Office of Field Operations (OFO) Total Encounters1 | 216,370 | 281,881 | 288,523 | 241,786 | 41,136 |
| U.S. Border Patrol Total Encounters2 | 310,531 | 404,142 | 859,501 | 405,036 | 135,159 |
| Total Enforcement Actions | 526,901 | 683,178 | 1,148,024 | 646,822 | 176,295 |
1 Beginning in March FY20, OFO Encounters statistics include both Title 8 Inadmissibles and Title 42 Expulsions. To learn more, visit: Title-8-and-Title-42-Statistics. Inadmissibles refers to individuals encountered at ports of entry who are seeking lawful admission into the United States but are determined to be inadmissible, individuals presenting themselves to seek humanitarian protection under our laws, and individuals who withdraw an application for admission and return to their countries of origin within a short timeframe.
2 Beginning in March FY20, USBP Encounters statistics include both Title 8 Apprehensions and Title 42 Expulsions. To learn more, visit: Title-8-and-Title-42-Statistics. Apprehensions refers to the physical control or temporary detainment of a person who is not lawfully in the U.S. which may or may not result in an arrest.
Search and Rescue Efforts
CBP agents frequently conduct life-saving efforts, while carrying out their respective missions. Numbers below reflect Fiscal Year (FY) 2019 - FY 2021 to date (TD).
Fiscal Year 2021 runs October 01, 2020 - September 30, 2021.
| FY19 | FY20 | FY21 TD NOV | |
|---|---|---|---|
| U.S. Border Patrol - Southwest Border Only | 4,920 | 5,071 | 1,224 |
| Air and Marine Operations - Nationwide | 377 | 184 | 43 |
Arrests of Individuals with Criminal Convictions or Those Wanted by Law Enforcement
Arrests of Individuals with Criminal Convictions or Those Wanted by Law Enforcement
Numbers below reflect FY 2017 - FY 2021 to date (TD).
Fiscal Year 2021 runs October 01, 2020 - September 30, 2021.
| FY17 | FY18 | FY19 | FY20 | FY21 TD NOV | |
|---|---|---|---|---|---|
| Office of Field Operations | |||||
| Criminal Aliens Encountered3 | 10,596 | 11,623 | 12,705 | 7,009 | 568 |
| NCIC4 Arrests | 7,656 | 5,929 | 8,546 | 7,108 | 1,226 |
| U.S. Border Patrol | |||||
| Criminal Aliens Encountered3 | 8,531 | 6,698 | 4,269 | 2,438 | 1,741 |
| Criminal Aliens with Outstanding Wants or Warrants | 2,675 | 1,550 | 4,153 | 2,054 | 272 |
3Criminal Aliens refers to aliens who have been convicted of crime, whether in the United States or abroad, so long as the conviction is for conduct which is deemed criminal by the United States. Criminal aliens encountered at ports of entry are inadmissible, absent extenuating circumstances, and represent a subset of total OFO inadmissibles. U.S. Border Patrol arrests of criminal aliens are a subset of total apprehensions. See U.S. Border Patrol Criminal Alien Statistics for a breakdown of criminal alien stats by type of conviction.
4NCIC (National Crime Information Center) arrests refers to the number of CBP arrests of individuals, including U.S. citizens, who are wanted by other law enforcement agencies.
Currency Seizures
Office of Field Operations Nationwide Currency Seizures
Numbers below reflect FY 2015 - FY 2021 to date (TD).
Fiscal Year 2021 runs October 01, 2020 - September 30, 2021.
| FY15 | FY16 | FY17 | FY18 | FY19 | FY20 | FY21 TD NOV | |
|---|---|---|---|---|---|---|---|
| Amount (USD) | $75,964,824 | $62,101,328 | $65,002,856 | $63,691,464 | $68,879,080 | $93,302,645 | $9,208,846 |
Nationwide Monthly Office of Field Operations Currency Seizures
Numbers below reflect FY 2018 - FY 2019 and FY 2021 to date (TD).
Fiscal Year 2021 runs October 01, 2020 - September 30, 2021.
| FY18 | FY19 | FY20 | FY21 | |
|---|---|---|---|---|
| October | $6,198,201 | $4,190,389 | $4,782,909 | $5,730,600 |
| November | $4,303,600 | $4,360,441 | $5,426,672 | $3,478,246 |
| December | $4,907,494 | $4,415,486 | $7,143,022 | |
| January | $5,194,829 | $7,836,948 | $4,209,230 | |
| February | $4,604,973 | $5,574,578 | $4,058,508 | |
| March | $4,894,285 | $5,581,107 | $5,615,991 | |
| April | $13,424,674 | $13,733,814 | $8,097,239 | |
| May | $4,024,325 | $4,739,178 | $3,920,587 | |
| June | $3,168,422 | $4,607,755 | $3,248,196 | |
| July | $4,503,412 | $4,439,385 | $6,195,526 | |
| August | $4,249,027 | $5,442,547 | $36,355,753 | |
| September | $4,218,223 | $3,957,451 | $7,372,288 | |
| Total | $63,691,464 | $68,879,080 | $96,425,920 | $9,208,846 |
U.S. Border Patrol Nationwide Currency Seizures
Numbers below reflect FY 2015 - FY 2021 to date (TD).
Fiscal Year 2021 runs October 01, 2020 - September 30, 2021.
| FY15 | FY16 | FY17 | FY18 | FY19 | FY20 | FY21 TD NOV | |
|---|---|---|---|---|---|---|---|
| Amount (USD) | $4,741,288 | $7,924,537 | $5,869,004 | $7,176,142 | $6,805,695 | $8,933,512 | $1,029,869 |
Monthly U.S. Border Patrol Nationwide Checkpoint Currency Seizures
Numbers below reflect FY 2018 - FY 2021 to date (TD).
Fiscal Year 2021 runs October 01, 2020 - September 30, 2021.
| FY18 | FY19 | FY20 | FY21 | |
|---|---|---|---|---|
| October | $35,829 | $49,247 | $33,558 | $196,378 |
| November | $26,285 | $51,269 | $114,297 | $17,548 |
| December | $2,822 | $63,697 | $156,961 | |
| January | $203,213 | $59,857 | $52,649 | |
| February | $117,933 | $103,982 | $84,475 | |
| March | $157,669 | $110,924 | $36,301 | |
| April | $17,913 | $15,016 | $49,559 | |
| May | $256,033 | $129,766 | $691,640 | |
| June | $31,494 | $119,732 | $511,781 | |
| July | $14,339 | $86,696 | $159,504 | |
| August | $169,592 | $141,475 | $275,751 | |
| September | $80,358 | $33,487 | $124,274 | |
| Total | $1,113,480 | $965,148 | $2,290,750 | $213,926 |
Drug Seizures
Office of Field Operations Nationwide Drug Seizures
Numbers below reflect FY 2015 - FY 2021 to date (TD).
Fiscal Year 2021 runs October 01, 2020 - September 30, 2021.
| FY 15 | FY 16 | FY 17 | FY 18 | FY 19 | FY20 | FY21 TD NOV | |
|---|---|---|---|---|---|---|---|
| Cocaine | 38,346 | 52,838 | 62,415 | 51,592 | 89,485 | 42,645 | 15,257 |
| Heroin | 6,023 | 4,224 | 3,398 | 5,205 | 5,417 | 5,222 | 1,108 |
| Marijuana | 602,821 | 516,122 | 366,627 | 299.419 | 289,517 | 324,973 | 41,232 |
| Methamphetamine5 | 25,495 | 33,086 | 46,247 | 57,440 | 127,497 | 156,901 | 36,021 |
| Fentanyl | 70 | 596 | 1,875 | 1,895 | 2,575 | 3,967 | 1,807 |
*weights are in pounds (lb)
5As of 01 October 2019, category includes both Methamphetamine and Crystal Methamphetamine.
Monthly Office of Field Operations Nationwide Drug Seizures
Numbers below reflect FY 2021.
Fiscal Year 2021 runs October 01, 2020 - September 30, 2021.
| Monthly | Marijuana | Cocaine | Heroin | Methamphetamine5 | Fentanyl | Other |
|---|---|---|---|---|---|---|
| October | 33,256 | 10,180 | 593 | 21,219 | 1,075 | 16,471 |
| November | 7,976 | 5,077 | 515 | 14,802 | 732 | 17,469 |
*weights are in pounds (lb)
5As of 01 October 2019, category includes both Methamphetamine and Crystal Methamphetamine.
U.S. Border Patrol Nationwide Drug Seizures
Numbers below reflect FY 2015 - FY 2021 to date (TD).
Fiscal Year 2021 runs October 01, 2020 - September 30, 2021.
| FY 15 | FY 16 | FY 17 | FY 18 | FY 19 | FY20 | FY21 TD NOV | |
|---|---|---|---|---|---|---|---|
| Cocaine | 11,220 | 5,473 | 9,346 | 6,550 | 11,682 | 15,360 | 4,373 |
| Heroin | 518 | 566 | 953 | 568 | 808 | 546 | 106 |
| Marijuana | 1,538,307 | 1,294,052 | 861,231 | 461,030 | 266,882 | 257,440 | 28,436 |
| Methamphetamine | 6,443 | 8,224 | 10,328 | 11,314 | 14,434 | 20,795 | 2,811 |
| Fentanyl | n/a | 105 | 181 | 388 | 226 | 809 | 213 |
*weights are in pounds (lb)
Monthly U.S. Border Patrol Nationwide Checkpoint Drug Seizures
Numbers below reflect FY 2021.
Fiscal Year 2021 runs October 01, 2020 - September 30, 2021.
| Marijuana | Cocaine | Heroin | Methamphetamine | Fentanyl | Other | |
|---|---|---|---|---|---|---|
| October | 936 | 307 | 38 | 848 | 105 | 110 |
| November | 1,296 | 299 | 56 | 1,278 | 44 | 8 |
*weights are in pounds (lb)
See Air and Marine Operations Statistics for a breakdown of enforcement actions with non-CBP agencies.
Gang Affiliated Enforcement
U.S. Border Patrol Nationwide Apprehensions by Gang Affiliation
Numbers below reflect FY2015 - FY2021.
Fiscal Year 2021 runs October 01, 2020 - September 30, 2021.
| Gang Affiliation | FY15 | FY16 | FY17 | FY18 | FY19 | FY20 | FY21 TD NOV |
|---|---|---|---|---|---|---|---|
| 107th St | 0 | 0 | 0 | 1 | 0 | 0 | 0 |
| 18th Street | 84 | 47 | 61 | 145 | 168 | 36 | 5 |
| Angelino Heights Sureno 13 | 0 | 0 | 1 | 0 | 0 | 0 | 0 |
| Bandidos | 0 | 4 | 0 | 0 | 0 | 0 | 0 |
| Barrio Azteca | 6 | 0 | 3 | 4 | 0 | 1 | 0 |
| Barrio Van Nuys | 0 | 0 | 0 | 0 | 1 | 0 | 0 |
| Border Brothers | 0 | 0 | 0 | 1 | 1 | 0 | 0 |
| Brown Pride | 0 | 0 | 0 | 0 | 0 | 0 | 0 |
| Chirizos | 0 | 0 | 0 | 1 | 0 | 0 | 0 |
| Folk Nation | 0 | 1 | 0 | 0 | 0 | 0 | 0 |
| Hard Times 13 | 0 | 1 | 0 | 0 | 0 | 0 | 0 |
| Hells Angels | 0 | 0 | 0 | 0 | 1 | 0 | 0 |
| Hermanos Pistoleros Latinos (HPL) | 2 | 18 | 3 | 2 | 2 | 2 | 1 |
| Latin Kings | 16 | 0 | 6 | 7 | 24 | 4 | 0 |
| Locos Surenos Trece | 0 | 1 | 0 | 1 | 0 | 0 | 0 |
| Los Traviosos | 0 | 0 | 0 | 0 | 1 | 0 | 0 |
| Los Zetas | 0 | 1 | 0 | 0 | 0 | 0 | 0 |
| MS-13 | 335 | 253 | 228 | 413 | 464 | 72 | 12 |
| Mara 18 | 0 | 0 | 0 | 1 | 2 | 1 | 0 |
| Mara-R | 0 | 0 | 1 | 1 | 0 | 0 | 0 |
| Maravilla Salva Trucha | 0 | 1 | 0 | 2 | 0 | 1 | 0 |
| Market Street | 0 | 0 | 0 | 0 | 1 | 0 | 0 |
| Mexican Mafia | 4 | 6 | 4 | 3 | 7 | 2 | 1 |
| Mexicles | 0 | 0 | 0 | 0 | 0 | 0 | 0 |
| Mexikanemi | 2 | 0 | 3 | 0 | 0 | 0 | 0 |
| Nortenos | 14 | 5 | 6 | 5 | 6 | 1 | 1 |
| Other | 154 | 136 | 90 | 82 | 110 | 75 | 23 |
| Outlaws | 0 | 0 | 0 | 0 | 0 | 0 | 0 |
| Pacific Street Gang | 0 | 0 | 0 | 0 | 0 | 0 | 1 |
| Paisas | 73 | 119 | 53 | 62 | 90 | 93 | 9 |
| Partido Revolucionario Mexican (PRM) | 0 | 0 | 0 | 0 | 1 | 0 | 0 |
| Playboys | 0 | 1 | 0 | 0 | 0 | 1 | 0 |
| San Fernando Valley Gang | 0 | 0 | 0 | 0 | 1 | 0 | 0 |
| South Los Angeles | 0 | 0 | 0 | 1 | 0 | 0 | 0 |
| Southwest Cholos | 0 | 0 | 0 | 0 | 1 | 0 | 0 |
| Surenos (sur-13) | 140 | 90 | 66 | 66 | 70 | 66 | 6 |
| Tango Blast | 14 | 16 | 8 | 8 | 20 | 7 | 0 |
| Texas Syndicate | 0 | 3 | 1 | 1 | 3 | 0 | 1 |
| Tortilla Flats | 0 | 0 | 0 | 0 | 0 | 1 | 0 |
| Vallucos | 0 | 0 | 0 | 0 | 1 | 0 | 0 |
| Vilanos-13 | 0 | 0 | 0 | 1 | 0 | 0 | 0 |
| West Park | 0 | 0 | 1 | 0 | 0 | 0 | 0 |
| Westside | 1 | 0 | 0 | ||||
| Zetas | 0 | 0 | 1 | 1 | 0 | 0 | 0 |
| Total | 844 | 702 | 536 | 808 | 976 | 363 | 60 |
U.S. Border Patrol Recidivism Rates
Recidivism percentages are updated at the end of each fiscal year.
| FY 15 | FY 16 | FY 17 | FY 18 | FY 19 | FY20 | |
|---|---|---|---|---|---|---|
| Recidivism5 | 14% | 12% | 10% | 11% | 7% |
5Recidivism refers to percentage of individuals apprehended more than one time by the Border Patrol within a fiscal year.