Issue | may-2019


NIH Inclusion Data by Research and Disease Category Now Available

For over two decades, NIH has required researchers to include women, members of racial and ethnic minority groups, and children in their work absent an acceptable scientific or ethical rationale for their exclusion. Now, for the first time, selected inclusion data on sex/gender and race/ethnicity are publicly available disaggregated for various research, condition, and disease areas.  

This reporting step continues our move towards enhancing transparency and accountability of the research we support. As part of implementing the 21st Century Cures Act and responding to recommendations from the Government Accountability Office, public reporting by NIH Research, Condition, and Disease Classification (RCDC) category helps ensure that women and minorities are appropriately included in biomedical research across a diverse array of diseases and conditions. At a recent meeting of the NIH Advisory Committee on Research on Women’s Health (go to 02:45), where this announcement was made, we also reported that in Fiscal Year (FY) 2018 over 52% of participants in NIH-supported clinical research were women, while about 29% of participants were members of racial minority groups, and 9% were ethnic minorities.

On the new NIH RCDC Inclusion Statistics Report webpage, you can see and download information for 269 of the 281 RCDC spending categories. Please note that inclusion data are not available for the remaining categories as they do not follow the standard RCDC categorization process (see this NIH Open Mike blog for more).

On the page, drop-down menus allow data to be easily filtered by the NIH Institute or Center. The menus allow you to exclude studies that focus on a single sex/gender, race, or ethnicity. Check out the FAQs for more information on how to interpret the data. And, similar to information available on other RePORT tools, data can be exported for offline analyses.

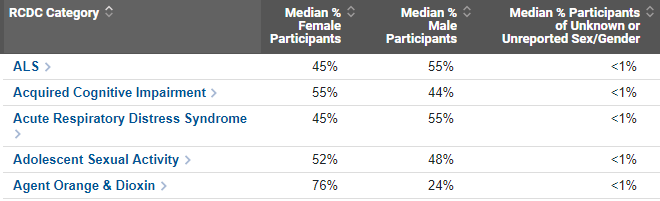
Let’s now look at some inaugural FY 2018 data. As shown in the screenshot displayed in Figure 1, RCDC categories are listed with inclusion data available on total counts for all participants and broken down by female and male. Median proportions are reported to give a sense of what a typical NIH study looks like (since averages are easily skewed by outliers).

Figure 1 shows a screen shot of inclusion data disaggregated by various RCDC categories.
Figure 1

By clicking on a single RCDC spending category, like amyotrophic lateral sclerosis (ALS) for example, NIH Institute and Center level inclusion data are presented, along with additional data on the number and proportion of participants in each category (Figure 2). Clicking on a specific NIH Institute or Center allows you to review all information on sex/gender, race, and ethnicity on one screen.

Figure 2 shows a screen shot of inclusion data for the ALS RCDC category disaggregated by NIH Institute or Center.
Figure 2

Focusing on the first NIH IC listed, as an example, we see that National Institute on Aging research included 451 participants in projects associated with the ALS category in FY 2018. 242 (54%) of participants were female, with a median proportion of 52% female participants. 208 participants were male (46%), with a median proportion of 47% male participants. Less than 11 participants (<1%) reported unknown sex/gender, thus exact counts and proportions are not displayed to protect participant privacy. Additional data on race and ethnicity of participants are available by using the drop-down menu on the page or clicking on the Institute name.

As part of overall RCDC reporting, the availability of inclusion data on research participants is another important step in increasing transparency of NIH-supported clinical research. It also helps us understand the generalizability of NIH research across populations. In future years, NIH plans to add data on age at enrollment of participants and allow users to view trends over time. We look forward to increased understanding of the distribution of participants in our research to ensure the knowledge gained from NIH research is applicable to those populations with the condition or disease under study.

We would like to thank staff within the NIH Office of Research on Women’s Health and the Office of Extramural Research for their work on this activity.

Sample Grant Applications, Summary Statements, and More

If you are new to writing grant applications, sometimes seeing how someone else has presented their idea can help as you are developing your own application. With the gracious permission of successful investigators, the National Institute of Allergy and Infectious Diseases (NIAID) makes available examples of funded R01, R03, R15, R21, SBIR/STTR, K, and F applications, summary statements, sharing plans, leadership plans, and more. When referencing these resources, it is important to remember:

  • These applications were developed using the application forms and instructions that were in effect at the time of their submission. Forms and instructions change regularly. Read and carefully follow the instructions in the funding opportunity announcement to which you are responding and the current application instructions carefully.
  • The best way to present your science may differ substantially from the approach taken by those who wrote the example applications. Seek feedback on your draft application from mentors and others.
  • Talk to an NIH program officer in your area of science for advice about the best type of grant program and the Institute or Center that might be interested in your idea.

Check out the NIAID’s Sample Applications and More.  

NIH Wants Your Input on Increasing Diversity Among Biomedical Research Faculty

Promoting scientific environments that can encourage and benefit from a full range of talent is necessary in biomedical research today. Because previous approaches focused on individuals have only slowly “moved the needle,” targeting systemic change is the next step for NIH.

The NIH Common Fund is conducting strategic planning for a potential new program exploring ways to create a route of entry and advancement for talent from diverse backgrounds into independent academic faculty positions. The goal is to employ a cohort model at the faculty level as a catalyst for institutions to create a route of entry and advancement for talent from diverse backgrounds, in the biomedical research enterprise.

NIH is seeking broad input on this approach from academic institutional leadership, biomedical faculty, and interested members of the public. Responses to this RFI will be accepted through May 16, 2019. For details, see the full Request for Information.

Redesigned eRA Website Provides New Resources

A newly revamped eRA website that serves as an informational gateway to applicants, grantees and reviewers was launched April 30.  The site provides new and updated ‘how-to’ information on navigating eRA systems like eRA Commons, ASSIST, IAR, xTrain and xTRACT; intuitive navigation; and improved accessibility.

Key highlights

  • Main screenshots of systems added to help figure out process at a glance
  • eRA Commons/ASSIST log-in buttons moved to prominent location on upper right-hand corner of home page
  • Hover drop-down menus added to menu topics on home page to provide a glimpse of inside content at a glance
  • New categories of information and updated ‘how-to’ content

Check out the website and a video that walks you through the highlights. Please send any questions or comments to eRACommunications@mail.nih.gov.

My resubmission of a competing renewal application (Type 2 A1) was not funded. May I submit a new renewal (Type 2 A0)?

No. Only a single resubmission of a competing newrevision, or renewal application (A0) will be accepted. After a resubmission of a competing renewal (Type 2) application that is not funded, a subsequent new renewal (Type 2 A0) application may not be submitted. The next application submitted on this topic should be submitted as a new application (Type 1 A0) on an appropriate due date for new applications (see NOT-OD-18-197 for exceptions).

For more information on resubmissions of NIH applications, see our FAQ page.

Upcoming Change in Federal-wide Unique Entity Identifier Requirements

Currently when applying for Federal grants or cooperative agreements, all applicant organizations must have a DUNS number as the Universal Identifier. The General Services Administration (GSA) recently announced that DUNS will be replaced by a new Government-owned unique entity identifier in all systems, including Grants.gov and eRA Commons. The new government unique identifier will be incorporated into the SAM registration process, eliminating the need for applicants to seek external identifiers in order to register.

The transition is ongoing, and more information on this to come as NIH learns more.

For other details, see the full Guide Notice.

How Many Researchers? …Revisited…the FY 2018 NIH’s Cumulative Investigator Rate

In March 2018, we showed data suggesting that, despite still being in a state of hyper-competition (as described in this post), the severity may be lessening. The number of unique applicants for NIH research project grants (RPGs) appeared to stabilize after many years of uninterrupted growth. Furthermore, a person-based metric, called the cumulative investigator rate, started to rise in fiscal year (FY) 2015 for RPGs after declines in previous years.

With FY 2018 grants information now available in the NIH Data Book, we wanted to see if this positive trend continued. As in my March 2018 blog, the FY 2018 cumulative investigator rate data discussed in this post were acquired on all NIH RPGs as well as specifically for R01-equivalent, P01, and R21 grant types for FYs 2003 to 2018.

Investigators designated on awards (referred to as “awardees” in this post) were only counted once per FY. Investigators designated on applications regardless of being funded (referred to as “applicants” here) were counted once in the current FY plus the four preceding FYs. The Cumulative Investigator Rate represents the proportion of these awardees over applicants in a particular FY.

Let’s start by looking at the number of RPG applicants and awardees over time (Figure 1). As noted last year, the number of unique applicants over a 5-year window (line with green triangles) gradually increased between FYs 2003 (the end of the NIH doubling) to 2015 from 56,758 to 87,838. The number of applicants then levels off, with 87,768 in FY 2018. Over the same time, the number of unique RPG awardees (line with red circles) gradually increased from 25,479 in FY 2003 to 31,595 in FY 2018. Similar to the uptick seen in FY 2017, the FY 2018 Cumulative Investigator Rate (line with blue squares) continued to rise to 36.0 percent.

Figure 1 shows a line graph with applicants, awardees, and the Cumulative Investigator Rate for RPGs over time. The X axis is fiscal years 2003 to 2018, while the Y axis is either the absolute number (in thousands) for applicants and awardees or a percent for the Cumulative Investigator Rate from 0 to 100. Awardees, applicants, and the Cumulative Investigator Rate are shown in separate red circle, green triangle, and blue square lines, respectively.
Figure 1

As NIH supports a diverse array of RPGs, let’s focus now on some common grant types to see what happened in FY 2018. Let’s begin with R01-equivalent grants. Please note that the definition of R01-equivalents was expanded in 2018 to include additional grant types as described in our recent FY 2018 By The Numbers (success rate) post.

Figure 2 shows the number of applicants over a 5-year window (line with green triangles) rose steadily from 47,480 in FY 2003 to 63,024 in FY 2014, where it again levels off, with 63,490 in FY 2018. For the most part, the number of unique awardees (line with red circles) remained relatively stable over time, with a notable increase in FY 2017 and FY 2018 with 24,320 and 25,868 awardees, respectively. Again, we see an uptick in the Cumulative Investigator Rate (line with blue squares) to 40.7 percent in FY 2018.

Figure 2 shows a line graph with applicants, awardees, and the Cumulative Investigator Rate for R01-equivalent grants over time. The X axis is fiscal years 2003 to 2018, while the Y axis is either the absolute number (in thousands) for applicants and awardees or a percent for the Cumulative Investigator Rate from 0 to 80. Awardees, applicants, and the Cumulative Investigator Rate are shown in separate red circle, green triangle, and blue square lines, respectively.
Figure 2

Now, what about P01 program grants? As a reminder, these grants usually support groups involving multiple researchers designed to achieve results that cannot be attained by investigators working independently. We can see the number of applicants over a 5-year window (line with green triangles) for P01s fluctuated, with 1,553 in FY 2003, peaking at 1,721 in FY 2013, and declining to 1,350 in FY 2018 (Figure 3). The number of unique awardees (line with red circles) fell from 935 in FY 2003 to 506 in FY 2018. Despite the drop in the Cumulative Investigator Rate (line with blue squares) generally seen between FYs 2003 to 2016, it does appear to begin rebounding afterwards, to 37.5 percent in FY 2018.

Figure 3 shows a line graph with applicants, awardees, and the Cumulative Investigator Rate for P01s over time. The X axis is fiscal years 2003 to 2018, while the Y axis is either the absolute number (in tens) for applicants and awardees or a percent for the Cumulative Investigator Rate from 0 to 200. Awardees, applicants, and the Cumulative Investigator Rate are shown in separate red circle, green triangle, and blue square lines, respectively.
Figure 3

Turning our attention to R21 grants, which support early and conceptual exploratory research, the number of applicants over a 5-year window (line with green triangles) increased steadily from 10,437 in FY 2013 to 40,591 in FY 2015 (Figure 4). Again, the number of applicants levels off, with 40,533 in FY 2018. The number of unique awardees (line with red circles) generally rose over this timeframe, landing at 4,786 in FY 2018. As with other grant types, the Cumulative Investigator Rate (line with blue squares) also rose in FY 2018 to 11.8 percent, from a low of 10.5 percent in FY 2014.

Figure 4 shows a line graph with applicants, awardees, and the Cumulative Investigator Rate for R21s over time. The X axis is fiscal years 2003 to 2018, while the Y axis is either the absolute number (in thousands) for applicants and awardees or a percent for the Cumulative Investigator Rate from 0 to 50. Awardees, applicants, and the Cumulative Investigator Rate are shown in separate red circle, green triangle, and blue square lines, respectively.
Figure 4

In summary, the number of unique RPG, R01-equivalent, and R21 (but not P01) awardees rose again in FY 2018. The Cumulative Investigator Rate also rose for all RPGs, R01-equivalents, R21s, and P01s in FY 2018, due in part to the leveling-off or declines in the number of unique applicants. This suggests that the early trends observed last year in the numbers of scientists NIH supported continued into FY 2018.

I would like to thank my colleagues in the Office of Extramural Research Division of Statistical Analysis and Reporting for their work on these analyses.

New “All About Grants” Podcast on Maintaining Confidentiality in Peer Review

Photo of Sally Amero
Sally Amero, Ph.D., NIH’s Review Policy Officer

Confidentiality is at the core of ensuring research ideas submitted in grant applications are protected. In this next installment of the NIH’s All About Grants podcast series, Sally Amero, Ph.D., NIH’s Review Policy Officer, discusses how NIH strives to maintain the highest levels of confidentiality and integrity in the peer review process (MP3 / Transcript). She highlights the core values of peer review, what reviewers agree to when serving on study sections, what may be discussed regarding study section meetings, and how applicants can learn more about the review of their application. Further, we delve into actions NIH may take when breaches in confidentiality occur.

Still have questions? Please visit the NIH Grants webpage on Integrity and Confidentiality in the Peer Review Process for more information.