

Chlorofluorcarbon-11 (CCl3F) — Combined Data Set
Since 1977 four different sampling programs in The Halocarbons and other Atmospheric Trace Species (HATS) group have measured chlorofluorcarbon-11 (CFC-11). The programs include two flask systems and two in situ programs. Flask measurements started in 1977 with six stations and continue today sampling at 15 locations (13 background air). The in situ program started in 1986 (called RITS) with a couple of gas chromatographs located at Mauna Loa, Hawaii and South Pole observatories. The following few years instruments were added at Barrow, Alaska, American Samoa, and Niwot Ridge, Colorado. A four channel gas chromatograph was developed in 1998 (called CATS) and replaced the RITS in situ instrumentation. The CATS gas chromatographs are currently deployed at six field sites and make hourly measurements.
A combined data set has been developed to incorporate all of the HATS monthly mean measurements made by each program. The combined data set is calculated by taking weighted averages of co-located measurements from background NOAA/ESRL GMD air measurement programs (listed below). All programs are on the same NOAA scale (NOAA 2016 scale for CFC-11) and every attempt is made to correct known biases between measurement programs; however, there maybe small differences that are not understood and characterized. When comparing measurements from station to station, be aware that not all locations are composed of the same measurement programs. The hemispheric and global means in the combined data set are our best measure of long-term trends and are used for international and national assessments for background air measurements. Displayed below are the data sets used to produce the combined data set as well as several figures.
| CFC-11 measurement programs | Start | Finish |
|---|---|---|
| HATS old flask instrument | 1977 | 1995 |
| HATS current flask instrument (OTTO) | 1995 | Current |
| HATS in situ (RITS program) | 1987 | 1999 |
| HATS in situ (CATS program) | 1998 | Current |
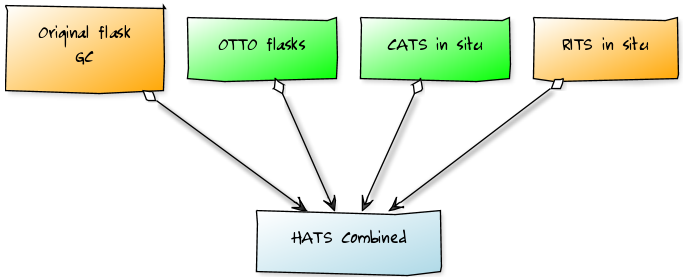
Current HATS programs (green rectangles) and discontinued programs (orange rectangles) are used in the combined data set. Click on a rectangle for a link to a specific program's data files.
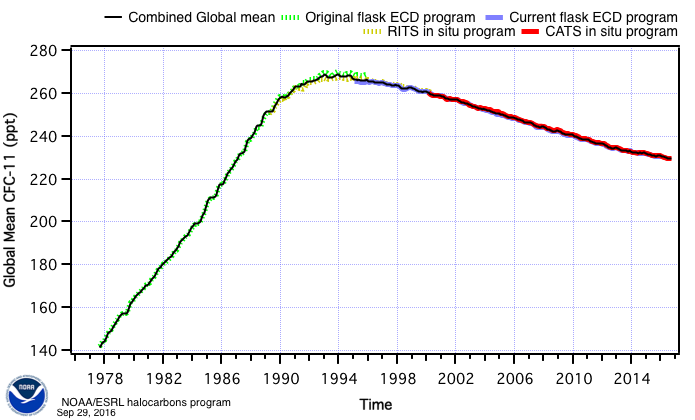
The figure above shows the different measurement programs' calculated global means and illustrates the overlap amongst programs (current programs are solid lines, dashed lines are discontinued programs). Measured monthly means from the different programs are statistically combined to create a long-term NOAA/ESRL GMD data set (black line). The combined data is calculated by first interpolating missing data at sampling location for each measurement program. A weighted average is subsequently calculated where there are co-located measurements from two or more programs. The gap filled station measurement is then smoothed with the Savitzky-Golay algorithm.
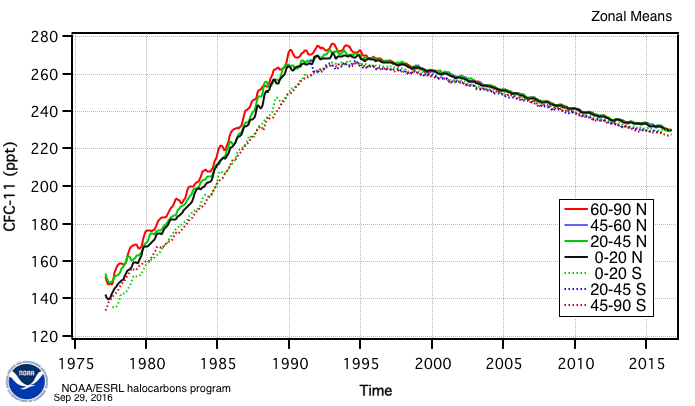
Zonal means are calculated for four northern (solid lines) and three southern (dashed lines) bins.
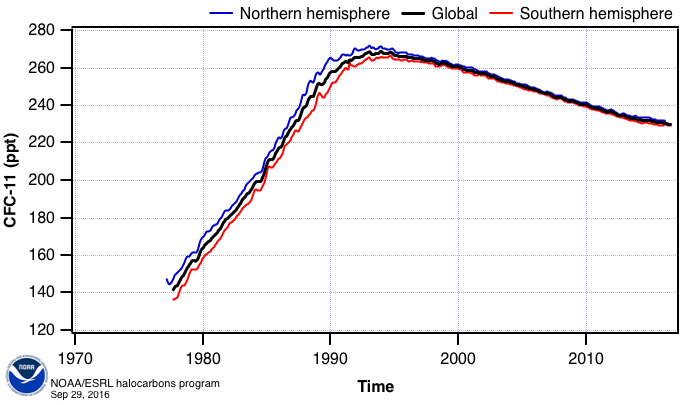
Hemispheric and a global mean are calculated from the zonal averages where sampling locations are weighted by the cosine of their latitude. This combined CFC-11 data set is used in NOAA's Annual Greenhouse Gas Index (AGGI) and NOAA's Ozone Depleting Gas Index (ODGI).

Global history of CFC-11 as a function of latitude (y-axis) and time (x-axis).
The Combined HATS CFC-11 Data File uses monthly data from the following programs:
- Original flask program: Monthly
- Current flask program: Monthly, Global
- RITS in situ program: Hourly, Daily, Monthly, Global
Selected Publications
- Montzka, S. A., J.H. Butler, R.C. Myers, T.M. Thompson, T.H. Swanson, A.D. Clarke, L.T. Lock, J.W. Elkins. Decline in the tropospheric abundance of halogen from halocarbons: Implications for stratospheric ozone depletion. Science 272, 1318-1322 (1996).
- Elkins, J. W., T. M. Thompson,T. H. Swanson, J. H. Butler, B.D. Hall, S.O. Cummings, D. A. Fisher A. G. & Raffo. Decrease in the growth rates of atmospheric chlorofluorocarbons 11 and 12. Nature 364, 780-783 (1993).