

Carbon Tetrachloride (CCl4)
Flask data used to derive U.S. CCl4 emissions in the study by Hu et al., 2016 can be found at the GMD ftp site.
Combined Data Set — The ESRL Halocarbons and other Atmospheric Trace Species (HATS) group has been measuring carbon tetrachloride (CCl4) with three separate programs since 1987. The programs include one flask system using gas chromatography with electron capture detector (ECD) and two in situ ECD measurement programs. Flask measurements started in 1995 with six stations and continue today sampling at 15 locations (13 background air). In situ measurements of CCl4 were started in 1987 with the RITS instruments and later replaced in 1998 by the CATS gas chromatographs that are currently installed at six remote field sites and make hourly measurements.
A combined data set has been developed to incorporate all of the HATS monthly mean measurements made by each program. The combined data set is calculated by taking weighted averages of co-located measurements from background NOAA/ESRL GMD air measurement programs (listed below). All programs are on the same NOAA scale (NOAA 2008 scale for CCl4) and every attempt is made to correct known biases between measurement programs; however, there maybe small differences that are not understood and characterized. When comparing measurements from station to station, be aware that not all locations are composed of the same measurement programs. The hemispheric and global means in the combined data set are our best measure of long-term trends and are used for international and national assessments for background air measurements. Displayed below are the data sets used to produce the combined data set as well as several figures.
Carbon tetrachloride and methyl chloroform loss during storage in stainless-steel canisters arises most commonly at high-latitude and/or high-altitude sites where the sample air is dry (i.e. ALT, BRW, MLO, NWR, and SPO — especially in winter). Extra efforts have been made to flag samples suspected of suffering from this known artifact, thereby barring them from inclusion in monthly mean estimates. The user is cautioned, however, that small biases to the low side may nevertheless remain in the OTTO flask data.
The HATS flask GC-MSD program also measurses CCl4, however this data has not yet been incorporated into the combined data set. GC-MSD flask data for CCl4 used in Hu et al., 2016 can be found on the GMD FTP site.
| CCl4 measurement programs | Start | Finish |
|---|---|---|
| HATS ECD flask instrument (OTTO) | 1995 | Current |
| HATS in situ (RITS program) | 1987 | 1999 |
| HATS in situ (CATS program) | 1998 | Current |

Current HATS programs (green rectangles) and discontinued programs (orange rectangles) are used in the combined data set. Click on a rectangle for a link to a specific program's data files.

The figure above shows the different measurement programs' calculated global means and illustrates the overlap amongst programs (current programs are solid lines, dashed lines are discontinued programs). Measured monthly means from the different programs are statistically combined to create a long-term NOAA/ESRL GMD data set (black line). The combined data is calculated by first interpolating missing data at sampling location for each measurement program. A weighted average is subsequently calculated where there are co-located measurements from two or more programs. The gap filled station measurement is then smoothed with the Savitzky-Golay algorithm.

Zonal means are calculated for four northern (solid lines) and three southern (dashed lines) bins.
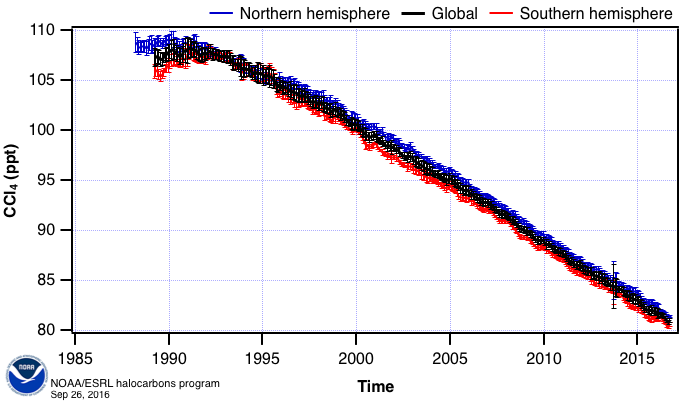
Hemispheric and a global mean are calculated from the zonal averages where sampling locations are weighted by the cosine of their latitude. Measurements during the 1980s to early 1990s from the RITS program were less precise than the current measurement programs (OTTO and CATS) and appear to have a bias in the Southern hemisphere. This combined CCl4 data set is used in NOAA's Annual Greenhouse Gas Index (AGGI) and NOAA's Ozone Depleting Gas Index (ODGI).

Global history of CCl4 as function of a latitude (y-axis) and time (x-axis).
The Combined HATS CCl4 Data File uses monthly data from the following programs:
Selected Publication
- Hu, L., S. A. Montzka, B. R. Miller, A. E. Andrews, J. B. Miller, S. J. Lehman, C. Sweeney, S. M. Miller, K. Thoning, C. Siso, E. L. Atlas, D. R. Blake, J. de Gouw, J. B. Gilman, G. Dutton, J. W. Elkins, B. Hall, H. Chen, M. L. Fischer, M. E. Mountain, T. Nehrkorn, S. C. Biraud, F. L. Moore, and P. Tans (2016),Continued emissions of carbon tetrachloride from the United States nearly two decades after its phaseout for dispersive uses, Proc. Natl. Acad. Sci. USA, 113(11), 2880-2885. doi: 10.1073/pnas.1522284113.
- GC-MSD flask data for CCl4 used in Hu et al., 2016 can be found on the GMD FTP site.