
| Archived Satellite Imagery | Local Archive 21 Day GOES Archive - GOES East | GOES West Additional Archives Comprehensive Large Array-data Stewardship System (CLASS) NCDC GOES Archive NGDC GOES Archive University of Wisconsin (SSEC) Historical Imagery Operational Significant Event Imagery (OSEI) Saved Tropical Imagery: Hurricanes of 2005 Hurricane Sandy (October, 2012) Super Typhoon Haiyan (November, 2013) |
| Arctic GOES / POES Composite Imagery |
This composite imagery product is generated every one hour at the Visible, Infrared, Shortwave Infrared, Longwave Infrared, and the Water Vapor bands by using the following GOES and POES Imagers: GOES-13, GOES-15, Meteosat-7, MSG-10, Himawari-8, NOAA-18, NOAA-19, MetOp-A, MetOp-B, Aqua and Terra. Coverage: 50°N ˜ 90°N Product Link: 7 Days Band Imagery: Water vapor (~6.7 µm): Image Visible (~0.65 µm): Image Infrared (~11.0 µm): Image Shortwave Infrared (3.7 to 3.9): Image Longwave Infrared (~12.0 µm): Image |
|
| Composite Imagery: GOES | Geostationary Satellite Imagery (GOES) Continental US Composites GOES (Imager): 12 Km (Polar Stereographic Projection) Original 24Km: Page | VIS | IR | Water Vapor |
| Composite Imagery: POES |
Polar Satellite Imagery (POES) Equatorial Mercator Composites Hemisphere Composites Microwave - AMSU and SSMI Composite Sectors |
| Geographical Information Systems (GIS) | Spatial Data Products for Geographical Information Systems: All imagery available from an anonymous FTP server
(userid: your email address | password: anonymous) GOES Data: GOES East | GOES West Winds Data and Metadata | SST Data and Metadata Polar Data: AVHRR | TRMM | SSMI | AMSU Surface Data GIS Data Available Through Interactive Internet Mapping GIS Fire and Smoke Detection Web Page GIS Snow and Ice Mapping Web Page GIS GOES Aerosol and Smoke Product National Ocean Service's /nowCoast/: GIS Mapping Portal to Real-Time Coastal Information |
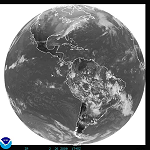
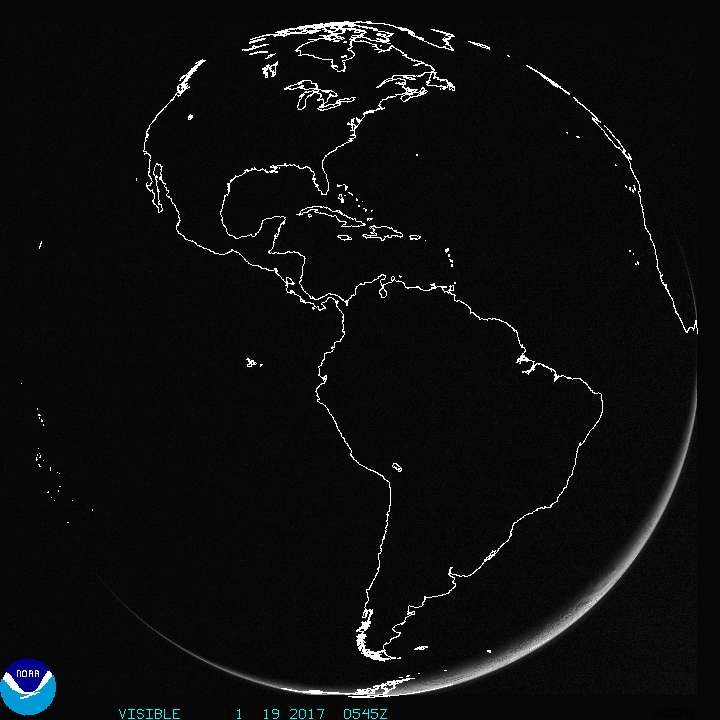
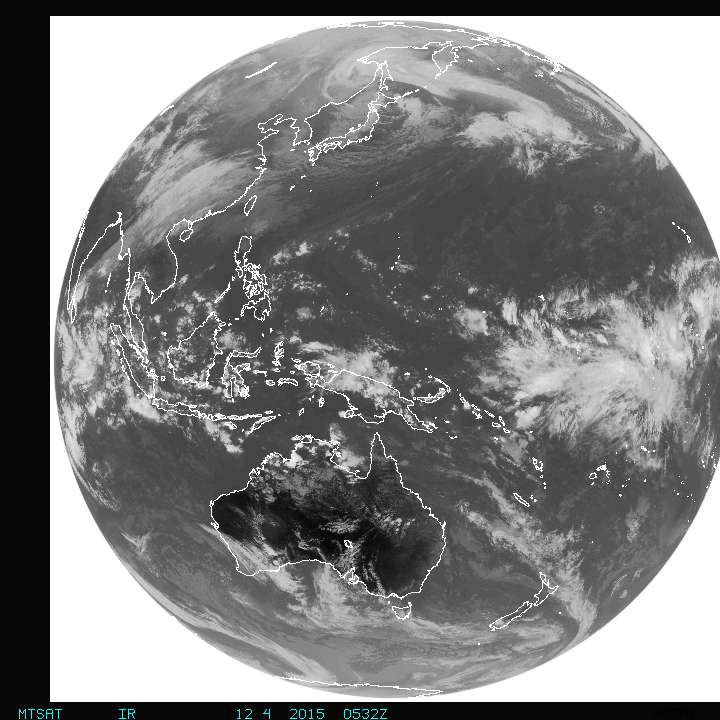
| Geostationary Satellite Server (GSS) | Full Disk Images: East - Infrared | Visible West - Infrared | Visible Sector Images: Synoptic Scale Sectors: Northern Hemisphere Southern Hemisphere Tropical Sectors Additional Northern Hemisphere Images and Loops - from NESDIS/STAR |
|
GSS Home Page |
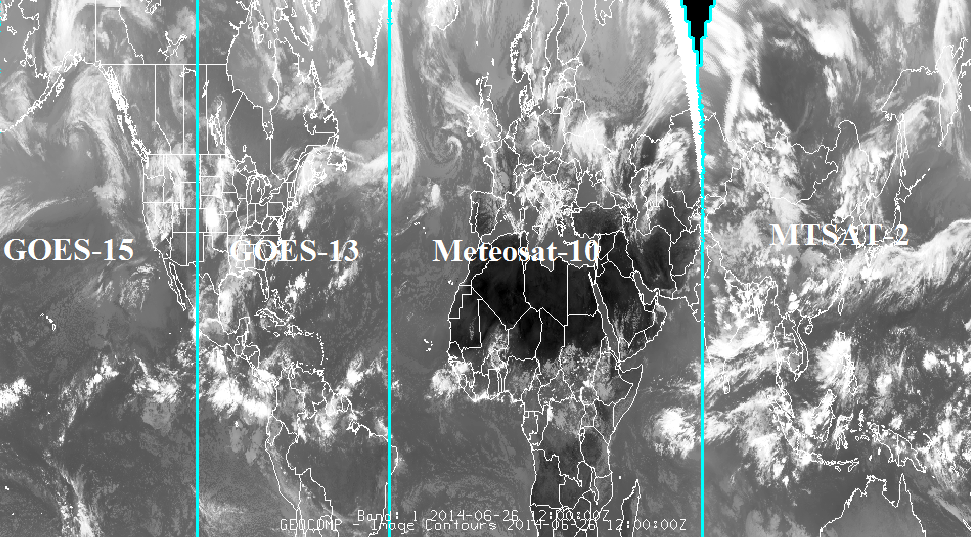
| Global Mosaic of Geostationary Satellite Imagery (GMGSI) | This product is generated every 3 hours including global geostationary longwave infrared (IR), shortwave IR and visible composites image at 8 km spatial resolution. In the generation of the global geostationary composite images, GOES, METEOSAT, and Himawari-8 datasets are remapped and concatenated using standard McIDAS image commands to generate an image dataset in AREA file and NetCDF format. Global Mosaic: Global Visible Mosaic - image | loop Global Longwave Infrared Mosaic - image | loop Global Shortwave Infrared Mosaic - image | loop Satellite Sensor Composite - image | loop |
|
|
|
||
| GOES, METEOSAT and Himawari-8 | Resolution: 8 Km | Frequency: 3 hours |
| Land Sectors |
GOES Composite Central U.S. | Northern Hemisphere GOES East (Overview) Eastern U. S. Regional Sectors: GOES West (Overview) Western U. S. Regional Sectors: MTSAT (Overview) |
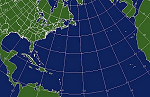
| Ocean Sectors | Geostationary Satellite Imagery (GOES) Atlantic Ocean Sectors (Includes SST and Tropical Floaters) Pacific Ocean Sectors (Includes SST and Tropical Floaters) Polar Sterographic Sectors Polar Satellite Imagery (POES) AMSU and SSMI Sectors This polar imagery is linked from the ocean sector pages (above) that are 4KM resolution or greater. |
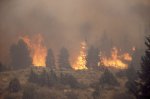
| Fire and Smoke | Operational Products Automated Biomass Burning Algorithm (ABBA) - from CIMSS Fire Id, Mapping and Monitoring Algorithm (FIMMA) Fire Product Archive GOES Aerosol Smoke Products (GASP): GOES Biomass Burning Emissions Product (GBBEP): Blended BBEP | GBBEPx Hazard Mapping System (HMS) Fire and Smoke Analysis Developmental Products Fire Risk Smoke Text Product Web Based GIS Fire Analysis (Download files) Satellite Imagery Fire/Smoke/Hot Spot Imagery Fire/Hot Spot Sectors: Florida | Northern California | Southern California GOES-East Sectors: Regional | WFO Sectors GOES-West Sectors: Regional | WFO Sectors |
|
| Volcanic Ash | Operational Products HYSPLIT Trajectories SO2 Detects from Ozone Monitoring Instrument (OMI) Washington, DC VAAC - Main Page | Volcanic Ash Advisories | Current Year Archive Satellite Imagery Real Time GOES Volcano Imagery Land Imagery |


