
| Aerosol | Operational Products Biomass Burning Emissions Product (BBEP) GOES Aerosol Smoke Product (GASP) |
|
|
| Archived Satellite Imagery | Local Archive 21 Day GOES Archive - GOES East | GOES West Additional Archives Comprehensive Large Array-data Stewardship System (CLASS) NCDC GOES Archive NGDC GOES Archive University of Wisconsin (SSEC) Historical Imagery Operational Significant Event Imagery (OSEI) Saved Tropical Imagery: Hurricanes of 2005 Hurricane Sandy (October, 2012) Super Typhoon Haiyan (November, 2013) |
| Blended TPW | Operational Products Overview Algorithm Product Animation North Pacific | Australia | Indian Ocean | South Pacific | East Asia Super National | South Indian Ocean | Europe
North Pacific | Australia | Indian Ocean | South Pacific | East Asia Super National | South Indian Ocean | Europe
North Pacific | Australia | Indian Ocean | South Pacific | East Asia Super National | South Indian Ocean McIDAS AWIPS: Puerto Rico | Alaska | Hawaii | Super National GPS Data: GPS Plot | GPS NCEP |
|
|
|
||
| Clouds | Operational Products Clavr-x Cloud Liquid Water MSPPS Sounder Cloud Top Pressure (GOES) Total Precipitable Water SSM/I Developmental Products Fog Depth Fog/Low Cloud Imagery Low Cloud Base Regional Imagery |
|
|
| Composite Imagery | Geostationary Satellite Imagery (GOES) Continental US Composites GOES (Imager): 12 Km (Polar Stereographic Projection) Original 24Km: Page | VIS | IR | Water Vapor Polar Satellite Imagery (POES) Equatorial Mercator Composites Hemisphere Composites Microwave - AMSU and SSMI Composite Sectors |
| Coral Bleaching | Operational Products Bleaching Alert Area Coral Bleaching Virtual Stations Degree Heating Week Charts HotSpots SST Anomaly Charts SST Nighttime Field Image Charts |
|
|
|
||
| Fire and Smoke | Operational Products Automated Biomass Burning Algorithm (ABBA) - from CIMSS Fire Id, Mapping and Monitoring Algorithm (FIMMA) Fire Product Archive GOES Aerosol Smoke Products (GASP): GOES Biomass Burning Emissions Product (GBBEP): Blended BBEP | GBBEPx Hazard Mapping System (HMS) Fire and Smoke Analysis Developmental Products Fire Risk Smoke Text Product Web Based GIS Fire Analysis (Download files) Satellite Imagery Fire/Smoke/Hot Spot Imagery Fire/Hot Spot Sectors: Florida | Northern California | Southern California GOES-East Sectors: Regional | WFO Sectors GOES-West Sectors: Regional | WFO Sectors |
|
| Geographical Information Systems (GIS) | Spatial Data Products for Geographical Information Systems: All imagery available from an anonymous FTP server
(userid: your email address | password: anonymous) GOES Data: GOES East | GOES West Winds Data and Metadata | SST Data and Metadata Polar Data: AVHRR | TRMM | SSMI | AMSU Surface Data GIS Data Available Through Interactive Internet Mapping GIS Fire and Smoke Detection Web Page GIS Snow and Ice Mapping Web Page GIS GOES Aerosol and Smoke Product National Ocean Service's /nowCoast/: GIS Mapping Portal to Real-Time Coastal Information |
| Geostationary Satellite Server (GSS) | Full Disk Images: East - Infrared | Visible West - Infrared | Visible Sector Images: Synoptic Scale Sectors: Northern Hemisphere Southern Hemisphere Tropical Sectors Additional Northern Hemisphere Images and Loops - from NESDIS/STAR |
|
GSS Home Page |
| Land Sectors |
GOES Composite Central U.S. | Northern Hemisphere GOES East (Overview) Eastern U. S. Regional Sectors: GOES West (Overview) Western U. S. Regional Sectors: MTSAT (Overview) |
| Microwave Integrated Retrieval System (MIRS) | Operational Products Cloud Liquid Water Ice Water Path Land Surface Emissivities Land Surface Temperature Liquid Water Path Moisture Profiles Rain Rate Rain Water Path Snow Cover Sea Ice Concentration Surface Type Classification Snow Water Equivalent Temperature Profiles Total Precipitable Water Operational Products by Satellite: POES Products Metop Products SSMIS Products |
|
|
|
||
| Microwave Surface and Precipitation Products System (MSPPS) | Operational Products Cloud Liquid Water Ice Water Path Land Surface Emissivities Land Surface Temperature Rain Rate Snow Cover Snow Fall Rate Sea Ice Snow Water Equivalent Total Precipitable Water Operational Products by Satellite: NOAA 15 Products NOAA 18 Products Metop-A Products NOAA 19 Products Metop-B Products |
|
|
|
||
| National Ice Center (NIC) | Operational Products Products on Demand Daily Ice Edge GRIB Files NAIS Outlooks & Forecasts Ross Sea Seasonal Outlook 15-Day WISIF Graphs Iceberg Table (pdf) IMS Ice & Snow Ice Analysis Products Daily Products Weekly Products Great Lakes Products Chesapeake Bay / Delaware Bay / Potomac River Polar Ice Extent Graphs Arctic Daily Arctic Weekly Antarctic Daily Antarctic Weekly KML Files Recent KML Files- Arctic Recent KML Files- Antarctic KML Archive Radarsat Wind KML Files ACNFS Drift KMZ Files |
|
|
|
||
| Ocean Color | Okeanos Operational Products Chlorophyll Concentration | Remote Sensing Reflectance Water Attenuation Coefficient Chlorophyll Concentration | Remote Sensing Reflectance Chlorophyll Concentration | Remote Sensing Reflectance Magnitude | Direction Chlorophyll Concentration | Remote Sensing Reflectance 8-Day Composite | Composite Calcite Concentration Other Operational Products |
|
|
|
||
| Satellite derived Ocean Heat Content |
Operational Products Satellite derived Ocean Heat Content: North Atlantic | North Pacific | South Pacific |
|
|
|
||
| Ocean Sectors | Geostationary Satellite Imagery (GOES) Atlantic Ocean Sectors (Includes SST and Tropical Floaters) Pacific Ocean Sectors (Includes SST and Tropical Floaters) Polar Sterographic Sectors Polar Satellite Imagery (POES) AMSU and SSMI Sectors This polar imagery is linked from the ocean sector pages (above) that are 4KM resolution or greater. |
| Ozone & Atmospheric Chemistry | Operational Products Global Ozone Monitoring Experiment 2 (GOME-2) Total Ozone Solar Backscatter Ultraviolet Version 2 (SBUV/2) Developmental Products GOES Total Ozone - from CIMSS |
|
|
| Precipitation | Operational Products Ensemble Tropical Rainfall Potential (eTRaP) Microwave Rain Rate: MSPPS | SSM/I | SSM/IS Precipitable Water Index Hydro-Estimator Rainfall NOAA Unique Megha-Tropiques Data and Products Satellite Precipitation Estimate Messages (SPENES) Total Precipitable Water ATOVS | MSPPS | SSM/I | |
|
|
||
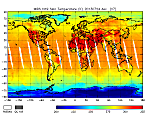
| Radiation Budget | Operational Products Absorbed Solar Energy - Daily & Monthly Available Solar Energy - Daily & Monthly Outgoing Longwave Radiation - Daily & Monthly |
|
|
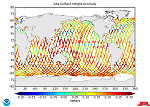
| Sea Surface Heights |
Developmental Products Sea Surface Height Anomaly |
|
|
|
||
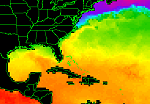
| Sea Surface Temperatures | Operational Products CoastWatch SST (POES) Overview | Geographic Locations | Data Archive SST Anomaly Charts SST Contour Charts SST Images SST Nighttime Field Image Charts SST Monthly Mean Developmental Products CoastWatch SST (GOES) |
|
|
|
||
| Sea/Lake Ice | Operational Products Sea Ice Concentration |
|
|
|
||
| Snow and Ice | Operational Products Snow Cover - MSPPS Snow Depth - SSM/I (Mapped) Snow and Ice Cover Analysis (IMS) - Daily NH 4-km | Daily SH 4-km Snow Water Equivalent Developmental Products Automated Snow Mapping System |
|
|
|
||
| Soundings | Operational Products ATOVS: Atmospheric Temperature; Vertical Statistics IASI GOES Sounder Gridded Cloud Products MIRS: Moisture Profiles; Temperature Profiles Satellite Cloud Product (SCP) NUCAPS: Global Gridded Images; Temperature Profiles; Retrieval Statistics; Outgoing Longwave Radiation Skew-T Profiles: GOES; POES Sounder DPI |
|
|
| Surface & Hydrology | Operational Products Land Surface Emissivity (MSPPS) Soil Moisture (SMOPS | SSM/I) Surface & Insolation Products (GSIP-fd | GSIP-v3) Land Surface Temperature (GLST) Surface Temperature (DPI ) (Image | Loop) Surface Temperature MSPPS | SSM/I Surface Type (SSM/I) | |
|
|
||
| Volcanic Ash | Operational Products HYSPLIT Trajectories SO2 Detects from Ozone Monitoring Instrument (OMI) Washington, DC VAAC - Main Page | Volcanic Ash Advisories | Current Year Archive Satellite Imagery Real Time GOES Volcano Imagery Land Imagery |
| Winds | Operational Products
High Density Infrared Cloud Drift Winds High Density Visible Cloud Drift Winds High Density Water Vapor Cloud Drift Winds GOES High Density Winds: 30 Days of Images SAR High Resolution Coastal Winds Ocean Surface Winds: (provides a partial mitigation for QuikSCAT which failed November 23, 2009) |
|
|
|
||


