


J2J Explorer (Beta)
Job-to-Job Flows Explorer is a web-based analysis tool that enables comprehensive access to an innovative new set of statistics on worker reallocation in the United States. Workers often build their careers through job-hopping and these flows between jobs are a primary means by which workers move up their career ladders. Flows of workers across employers, industries, and labor markets are subsequently quite large - about half of hires and separations in 2000 were job-to-job flows. Yet until now, they also represented a gap in the set of available statistics on employment dynamics.
New Job-to-Job Flows (J2J) statistics illuminate this enormous churn of workers between firms. Using longitudinal administrative data on workers' job histories, J2J traces worker movements through industries, geographic labor markets, and to/from employment.
J2J Explorer unlocks these statistics through an intuitive dashboard interface. The application's interactive visualizations allow for the construction of tables and charts to compare, aggregate and analyze flows by worker and firm characteristics. Potential analyses include identifying what industries are hiring manufacturing workers, what states have the highest rate of worker separations leading to persistent nonemployment, and a time-series analysis on the impacts of educational attainment on hires to North Dakota.
Learn more about J2J Explorer  (95 KB)
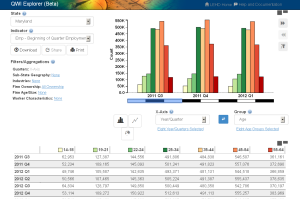
QWI Explorer
QWI Explorer is a new, web-based analysis tool that enables comprehensive access to the full depth and breadth of the Quarterly Workforce Indicators (QWI) dataset. Through charts, maps and interactive tables, users can compare, rank and aggregate QWIs across time, geography, and/or firm and worker characteristics on the fly.
QWI Explorer makes the entire QWI dataset available for visualization in line charts, bar charts, and thematic maps. The application's intuitive dashboard allows for the construction of pivot tables to compare and rank labor-force indicators such as employment, job creation and destruction, wages, and hires across a wide range of firm and worker characteristics. Potential analyses include a longitudinal look at wages by worker sex and age across counties, ranking job creation rates of young firms across NAICS industry groups, and comparing hiring levels by worker race and education levels across a selection of Metropolitan Areas.
Learn more about QWI Explorer
(115 KB)

OnTheMap
OnTheMap is an online mapping and reporting application showing where workers are employed and where they live with companion reports on worker characteristics and optional filtering by age, earnings, or industry groups. It provides an easy-to-use interface for creating, viewing, printing and downloading workforce related maps, profiles, and underlying data.
Based on 2002–2013 LEHD Origin Destination Employment Statistics (LODES), OnTheMap is a unique resource for mapping the travel patterns of workers and identifying small-area workforce characteristics.
A total of 50 state partners are currently featured, showing data for 12 years (2002 through 2013). The latest version of OnTheMap was released in August 2015.
Learn more about OnTheMap
(117 KB)

OnTheMap for Emergency Management
OnTheMap for Emergency Management is a public data tool that provides an intuitive web-based interface for accessing U.S. population and workforce statistics, in real time, for areas being affected by natural disasters.
The tool allows users to easily retrieve reports containing detailed workforce, population, and housing characteristics for hurricanes, floods, wildfires, winter storms, and federal disaster declaration areas.
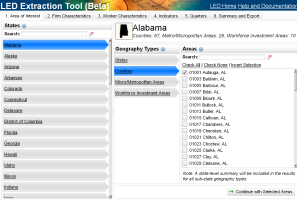
LED Extraction Tool
The LED Extraction Tool provides easy access to the raw data products produced through the Local Employment Dynamics (LED) Partnership. The Beta release of this tool makes the entire Quarterly Workforce Indicators (QWI) dataset available through a simple query-building interface.
The LED Extraction Tool provides:
- Access to all 32 QWIs, all available years/quarters, all firm and worker characteristics, the Beta release of National QWI, and 50 states (plus the District of Columbia).
- A streamlined interface that walks users through the process of selecting the data they need and ignoring the data they don't. Grab only a single tabulation, all the data for a particular cluster of industries or geographies, or a state's full longitudinal set of data using the intuitive query-building interface.
- Fast processing of the requested data tables, which are available for download as CSV and/or ZIP files (complete with metadata).
QWI Online
QWI Online has been retired and replaced with the QWI Explorer application.
Industry Focus
Industry Focus has been retired and replaced with the QWI Explorer application.


Cornell VirtualRDC
The Cornell VirtualRDC, hosted by Cornell University, provides access to public-use LEHD Quarterly Workforce Indicators (QWI), synthetic U.S. Census Bureau data, including LEHD Origin Destination Employment Statistics (LODES) data, and zero-observation datasets of data available in the Census RDCs. Synthetic data is constructed to statistically approximate the underlying data without compromising confidentiality.
All data on the VirtualRDC have been released for public purposes, and no confidential data are stored on the VirtualRDC. Public-use QWI and historical LODES data can be downloaded from the VirtualRDC. The most up to date LODES data can be accessed on the VirtualRDC through the Social Science Gateway or are available through the LEHD website.
Contact the VirtualRDC administrators at virtualrdc@cornell.edu for additional information about how to access and use the VirtualRDC.


