Photovoltaic Lifetime Project
High-accuracy public data on photovoltaic (PV) module degradation from the Department of Energy (DOE) Regional Test Centers, along with updated methodologies, will increase the accuracy and precision of degradation profiles calculated for representative PV hardware installed in the U.S.
Project developers' assumptions on the initial performance of PV systems can affect calculations of project finance and commercial viability. Due to the typical slow pace of PV module degradation—often less than 1% per year—the reported degradation can be undetectable (within measurement uncertainty) for the first several years of operation. However, with careful indoor current-voltage (I-V) curve methods and higher frequency of measurement, greater accuracy in degradation profile can be distinguished. This effort investigates equipment widely deployed across the U.S. and addresses multiple deployment climates. In particular, a focus is on early-life degradation of PV modules, which may indicate stepwise degradation functions that are too subtle to be detected through typical outdoor monitoring. Because of the leveraged nature of PV project finance, low initial degradation is more beneficial than constant degradation through the project lifetime (see figure below).

Low initial degradation (green curve) results in more-economical PV installations. Frequent intermediate measurements are required to distinguish one degradation profile from the other.
Tools and Capabilities
- Long-term deployment of PV systems with public data through the Regional Test Centers (RTCs)
- Validation and development of degradation rate standards
- Degradation assessment of existing PV system data.
Projects
Current activities are funded by the DOE Energy Efficiency and Renewable Energy Office through the PV Lifetime Project and the SunShot National Laboratory Multiyear Partnership (SuNLaMP) project. Currently, three PV module types are being investigated through the PV Lifetime Project. Additional module types will be installed in following years. Additional system information can be found at Sandia National Laboratories' PV Performance Modeling Collaborative website.
Jinko Solar. PV systems composed of 28 modules each of Jinko JKM260P-60 and Jinko JKM265P-60 modules were deployed at the National Renewable Energy Laboratory (NREL) (Golden, CO) and Sandia (Albuquerque, NM). The systems are grid-tied through an ABB TRIO 20.0 inverter, in two strings of 14 modules apiece.
NREL site: Initial baseline PV data were taken September 2016, with the modules installed in October 2016. The PV system will be grid-tied in January 2017. An initial light-induced degradation of ˜2% was detected following 10+ kWh/m2 of light exposure.
Sandia site: Installation is currently under way.

Jinko Solar PV Lifetime installation at NREL.

Light-induced degradation (LID) showed a 4–5 W power loss in the first 15 kWh/m2 of light exposure. See the Jinko I-V curve data.
Sandia site: Installation is currently under way.
Trina Solar. PV systems composed of 28 modules each of Trina TSM-PD05.08 260W and Trina TSM-PD05.05 255W (Black backsheet) modules were deployed at NREL (Golden, CO) and Sandia (Albuquerque, NM). The systems are grid-tied through an ABB TRIO 20.0 inverter, in two strings of 14 modules apiece.
NREL site: PV module baseline data were taken in October 2016, with modules installed October 26, 2016. The PV system will be grid-tied in January, 2017. An initial light-induced degradation of less than 1% was detected following 10 kWh/m2 of light exposure.

Trina Solar PV Lifetime installation at NREL.

Light-induced degradation showed a 1–2 W power loss in the first 10 kWh/m2 of light exposure. See the Trina I-V curve data.
SunPower. PV systems will be composed of 56 SunPower modules, with module purchase and installation to occur in calendar 2017.
Photovoltaic Degradation Publications
Journal articles, technical reports, conference papers, and outreach documents related of PV degradation rate are published through DOE SuNLaMP-sponsored work. Check out a summary of pertinent available DOE-sponsored research on degradation rates.
Progress and Frontiers in PV Performance (2016)
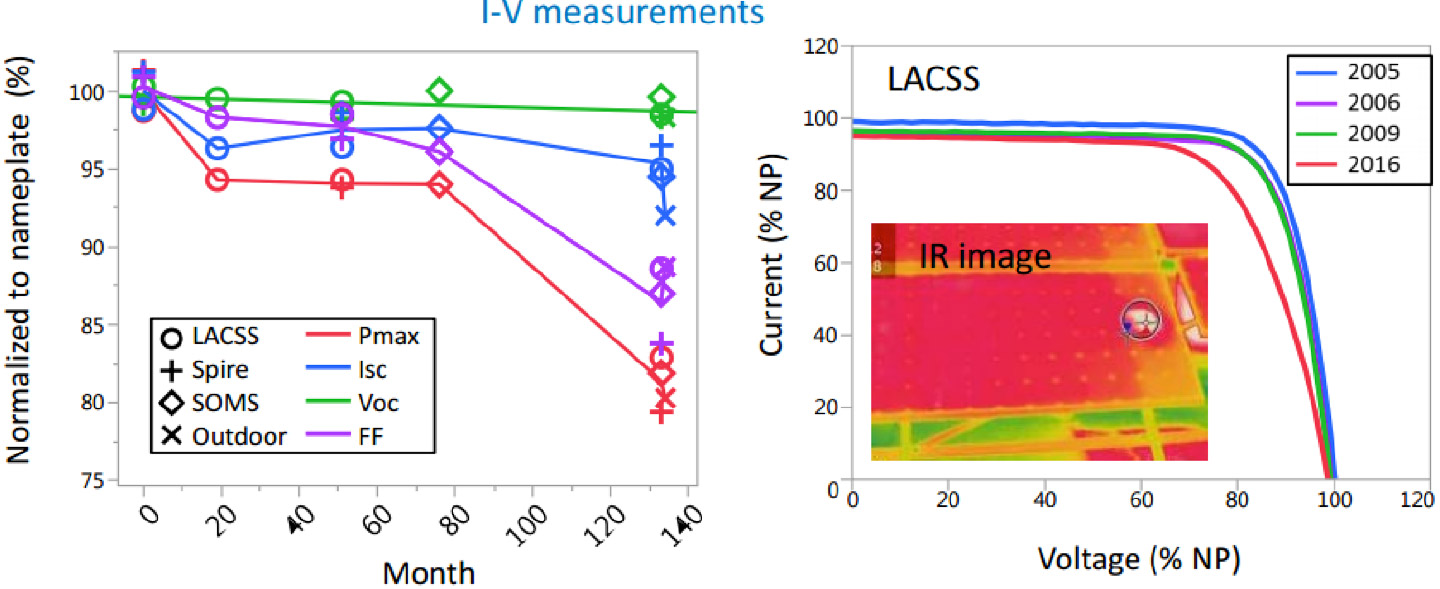
Different reliability failure modes may present themselves as performance loss that is non-linear, or piecewise linear. The crystalline silicon PV module below exhibited stable performance from 2006 through 2016 until a cell crack led to a hot spot and a sudden non-linear performance drop in maximum power.
The complete presentation on degradation can be found as part of an SPI 2016 workshop.
Insights into PV Levelized Cost of Energy through a New Degradation Study (2016)
An update to the original PV Degradation Rates paper has summarized over 11,000 data points and has distinguished between high-quality studies (multiple measurements) and single-point measurements that depend on the nameplate value of PV modules being correct. Using only high-quality data for crystalline silicon modules yields a degradation rate of 0.5% per year. See the blog post and the complete paper.

Histograms of all data, high-quality data, and the median per study and system presented as the normalized frequency (a). Cumulative distribution functions for high-quality crystalline silicon systems and modules (b). The median is indicated by a dashed horizontal line; 0.5%/year and 1%/year degradation are indicated as a dashed and dash-dotted line, respectively. The number of data points for the respective subsets is given in parentheses.
PV Degradation Methodology — A Basis for a Standard (2016)
Real-time outdoor data can be mined to extract system and module performance. However, the methodology used to filter and analyze the data can directly impact the calculated rate, particularly for short data time-series. In particular, two methods are compared: standard linear regression, and a year-on-year method.

Geographic distribution of installations included in the 1603 Treasury grant system survey (over 50,000 systems)
1603 Treasury Data Lifts the Veil on PV System Performance (2014)
An analysis of 1.7 gigawatts of PV installations (> 50,000 unique systems) has shown several trends. The first is that large-scale reliability problems have not been a problem in the first four operational years of these systems. Secondly, the systems in general performed better than expected—by 2%–4% on average. View the blog post and download the complete papers (paper 1 and paper 2).
Photovoltaic Degradation Rates — An Analytical Review (2011)
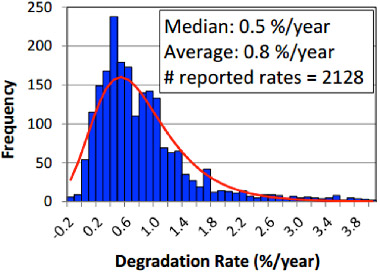
A review of the existing literature has identified 2,000 uniquely measured degradation rates. Median degradation rates for these modules are 0.5% per year. A long tail of lower-reliability products increases the average to 0.8% per year. This study was updated in 2016 (see above) with a significantly increased sample size. Read the original study.
Contact Us
For additional questions or comments, please contact the RTC team overseeing this effort:
Dr. Joshua Stein
RTC Lead, PV Lifetime Lead
Dr. Stein is a distinguished member of the technical staff at Sandia and the author of many papers related to the performance modeling of solar systems.
Dr. Chris Deline
Colorado RTC Lead, Colorado PV Lifetime Lead
Dr. Deline is the Colorado RTC Lead and leads the PV Lifetime effort at NREL. He is an NREL engineer who specializes in the characterization, modeling, and analysis of PV systems, especially under non-optimal (e.g., shaded) conditions.
Dr. Dirk Jordan
NREL Senior Reliability Engineer
Dr. Jordan is a senior reliability engineer at NREL heading up analytical research on PV performance and reliability. Dr. Jordan is a six-sigma black belt and has authored some of the most-cited papers on PV degradation rates.