Maps and Data
Find maps and charts showing transportation data and trends related to alternative fuels and vehicles.
OR
Sort by:
8 results
-
-
Annual Vehicle Miles Traveled in the U.S.
Trend of Vehicle-Miles Traveled in the U.S. from 1970-2016 Last update August 2016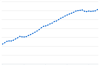
-
-
-
Average Commute to Work by State (Shortest and Longest)
Commute length for states with the most extreme commute times Last update August 2015
-
-
-
Average Fuel Economy of Major Vehicle Categories
Comparison of fuel economy among vehicle types Last update June 2015
-
-
-
Average Vehicle Trip Length by Purpose
Average trip length and distribution by trip type in U.S., 2009 Last update May 2012
-
-
-
Means of Transportation to Work
Trend of how people commuted to work from 1980-2012 Last update August 2014
-
-
-
Monthly Fluctuation in U.S. Vehicle Miles Traveled
VMT for each month of the year, averaged over a five year period Last update August 2015
-
-
-
Share of All Vehicle Trips by Trip Length
Average trip length and distribution by trip type in U.S., 2009 Last update September 2011
-
-
-
U.S. Light-Duty Fuel Consumption and Vehicle Miles Traveled (VMT)
Trend of per capita VMT and fuel use in U.S. light-duty vehicles from 1970-2012 Last update July 2014
-

Annual Vehicle Miles Traveled in the U.S.
| 1971 | 1972 | 1973 | 1974 | 1975 | 1976 | 1977 | 1978 | 1979 | 1980 | 1981 | 1982 | 1983 | 1984 | 1985 | 1986 | 1987 | 1988 | 1989 | 1990 | 1991 | 1992 | 1993 | 1994 | 1995 | 1996 | 1997 | 1998 | 1999 | 2000 | 2001 | 2002 | 2003 | 2004 | 2005 | 2006 | 2007 | 2008 | 2009 | 2010 | 2011 | 2012 | 2013 | 2014 | 2015 | 2016 | |
| Trillion Miles | 1.128168 | 1.200898 | 1.276857 | 1.300512 | 1.297834 | 1.341416 | 1.413035 | 1.475402 | 1.55536 | 1.528928 | 1.52287 | 1.541724 | 1.606475 | 1.657857 | 1.720246 | 1.787798 | 1.857631 | 1.939041 | 2.041441 | 2.117716 | 2.141582 | 2.18883 | 2.25382 | 2.297939 | 2.38672 | 2.417911 | 2.496251 | 2.570334 | 2.626392 | 2.697095 | 2.754784 | 2.808501 | 2.854268 | 2.90417 | 2.972672 | 2.999419 | 3.01336 | 3.033301 | 2.964202 | 2.945037 | 2.972089 | 2.955092 | 2.968797 | 2.984728 | 3.055252 | 3.172334 |
Source: Federal Highway Administration
Notes: VMT counts include those of light-, medium-, and heavy-duty vehicles.
*12-month VMT counts aggregated in February of any given year.
Travel Trends page on any month has moving 12 month average
This chart shows trends in total vehicle miles traveled in the United States (expressed as a moving 12-month count) from 1971 through 2016. The long rise in the number of vehicle miles traveled has seen three periods of flattened growth or decline, triggered by the oil price spikes of 1974, 1979, and 2008. The VMT flattening that started in 2008 continued long after oil prices recovered, largely due to an economic recession. However, VMT rose substantially again in 2015 and 2016 largely because the U.S. economy recovered from the recession and petroleum prices remained low. 2016 experienced the largest annual increase in VMT since tracking began in 1971.
Print