The El Paso widget allows an application to view multiple aerial images (and StreetView) to add context to any map. It is the first GeoPlatform compliant widget made available in EPA’s GitHub.

This page shows the green apps we’ve collected that use EPA data. You can sort them by topic and platform or you can search for them in the search box. Submit an application here. Before you submit an app, please read our application disclaimer.
The El Paso widget allows an application to view multiple aerial images (and StreetView) to add context to any map. It is the first GeoPlatform compliant widget made available in EPA’s GitHub.
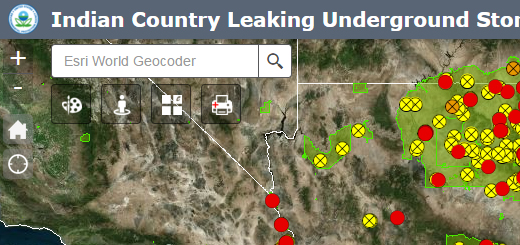
This interactive mapping system displays Leaking UST sites in EPA Region 9 Indian Country (both active and closed cleanup cases). Popup windows for each site contain location information, facility status, release dates, case closure dates (if applicable), and links to No Further Action letters (if applicable).
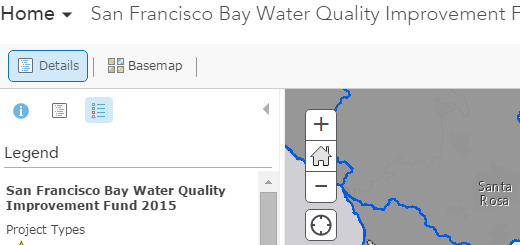
This web map shows the locations and descriptions of projects funded by the EPA San Francisco Bay Water Quality Improvement Fund as well as water quality impairments around the Bay. It also shows large watershed boundaries and major rivers and creeks.
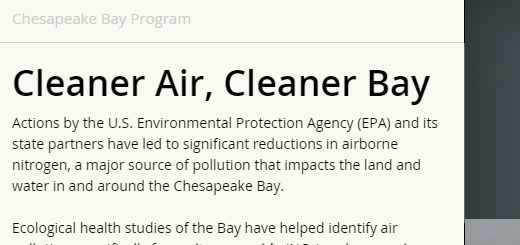
Actions by the U.S. Environmental Protection Agency (EPA) and its state partners have led to significant reductions in airborne nitrogen, a major source of pollution that impacts the land and water in and around the Chesapeake Bay. Ecological health studies of the Bay have helped identify air pollution, specifically from nitrogen oxide (NOx) and ammonia […]
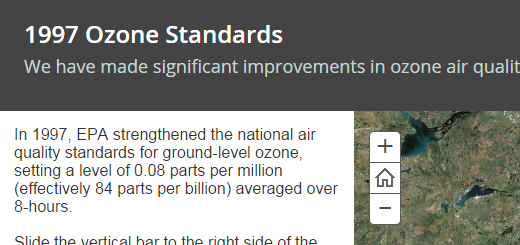
On October 1, 2015, the U.S. Environmental Protection Agency strengthened the National Ambient Air Quality Standards for ground-level ozone to 70 parts per billion, based on extensive scientific evidence about ozone’s effects on public health and welfare. The updated standards will improve public health protection, particularly for at-risk groups including children, older adults, people of […]
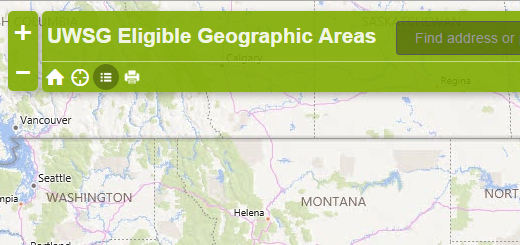
This map shows Urban Water Small Grant Eligible Geographic Areas. The Eligible Geographic Areas are based on the U.S. Census-defined Urbanized Areas and the 12-digit hydrologic unit code system (HUC-12) that defines the watershed. The HUC system is a national standard watershed system based on surface hydrologic features and delineated by the U.S. Geological Survey.
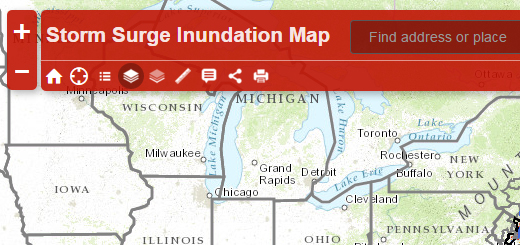
This map illustrates hurricane strike frequency and worst-case coastal storm surge or inundation scenarios derived from the: National Hurricane Center’s hurricane strike dataset Federal Emergency Management Agency’s 100-year and 500-year flood plains National Oceanic and Atmospheric Administration’s Sea, Lake, and Overland Surge from Hurricanes (SLOSH) model
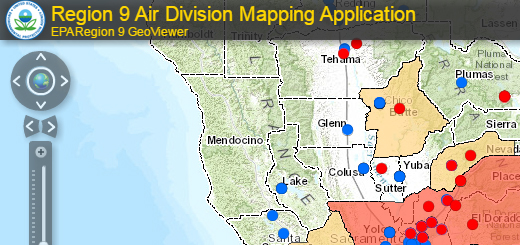
The EPA Region 9 Air Division Mapping Application (ADMA) displays public air quality information and provides access to 26 primary datasets and 47 unique layers.

This assessment is intended to provide state and local agencies with information on whether their monitoring networks still meet the monitoring objectives, whether new sites are needed, whether existing sites are no longer needed, and whether new technologies are appropriate, as required by 40 CFR Part 58.10(d).

10 Things to know about EPA’s Clean Power Plan