
PSD Interactive Climate Analysis and Plotting Web-Tools
Pages matching the search criteria above:
| Search and Plot PSD Data |

|
Search by variable or dataset from any PSD held dataset |
|
| Monthly/Seasonal Maps and Composites: NCEP/NCAR Reanalysis and other datasets |

|
Plots monthly and seasonal composites of variables (mean, anomalies and long-term means). Lat/Lon plots for any desired region, and height cross sections are available |
|
| Monthly/Seasonal Maps and Composites: 20th Century Reanalysis |

|
Plot monthly/seasonal composites. |
|
| Monthly/Seasonal Maps and Composites: SLP and SST Datasets |

|
Plot composites of monthly SLP and SST datasets from 1854 to present. Include Means, anomalies, and climatologies |
|
| Monthly/Seasonal Maps and Composites: US Climate Division Dataset (1895-->) |

|
Plots monthly and seasonal composites of US climate Division Data (temperature, precipitation and PDSI). Plots means, long-term means and anomalies and rankings. |
|
| WRIT: Reanalysis Intercomparison Tools: Monthly Mapping and Composites Web Page |

|
Plot and compare monthly/seasonal composites from different reanalyses and observational datasets including 20th Century Reanalysis |
|
| Daily Maps and Composites: NCEP/NCAR Reanalysis and related datasets |

|
Plots daily composites and averages over a range of dates of daily data from 1948 to the present. Has features useful for synopticians |
|
| Daily Maps and Composites: 20th Century Reanalysis |

|
Plot composites of the daily data from the 20th Century Reanalysis |
|
| Sub-Daily Maps and Composites: 20th Century Reanalysis |

|
Plot composites of the sub-daily data from the 20th Century Reanalysis |
|
| Sub-Daily Maps and Composites: NCEP/NCAR Renalayis: |

|
Plot 6-hourly composites from NCEP/NCAR R1 data. |
|
| Daily Maps and Composites: North American Regional Reanalysis (NARR) |

|
Plot composites of the daily data from the NARR. Includes means, anomalies, and climatologies. |
|
| Sub-Daily maps and composites: North American Regional Reanalysis (NARR) |

|
Plot composites of the sub-daily data from the NARR |
|
| Monthly/Seasonal Correlations: NCEP/NCAR Reanalysis and other datasets: |

|
Plots monthly and seasonal correlations of gridded variable with ocean/atmosphere index time-series like the PNA or ENSO. User can specify their own time-series |
|
| Monthly/Seasonal Correlations: US Climate Division Data |
|
Obtain maps of correlations with monthly mean or seasonal US Climate Division Data. Use provided atmosphere/ocean time-series like PNA or Niña 3.4 |
|
| Monthly Climate Indices (1948-->) |

|
Time-series: Plot monthly ocean/atmospheric time-series. |
|
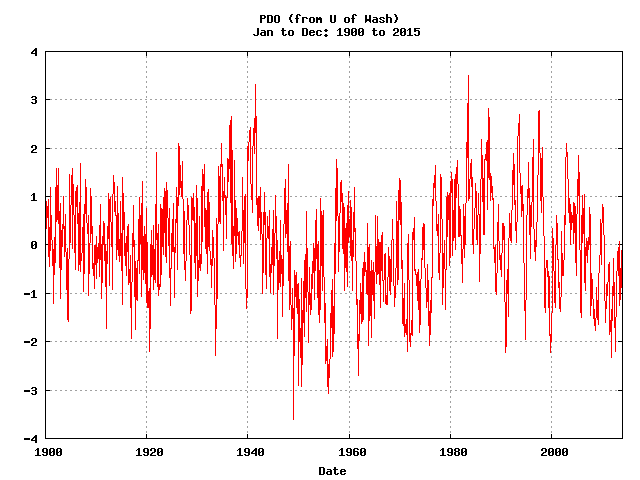
| Monthly Climate Indices: Plot and Analyze(1856-->) |
|
Plot and compare monthly climate index timeseries such as the PDO, the NPI, ENSO, and others. |
|
| WRIT: : Reanalysis Intercomparison Tools: Monthly Timeseries Plotting and Comparison Page |

|
Plot and compare monthly timeseries from different reanalyses and observational datasets including 20th Century Reanalysis |
|
| US Station Climatologies |

|
Point and Click or text interfaces to United States station data climatologies of temperature, precipitation and other variables where available. |
|
| Time-section Plots (Hovmollers): Reanalysis Datasets |

|
Plots time-section (time/lat or time/lon) of daily data including the 20th Century Reanalysis |
|
| US Station Data (Daily): time series, climatologies, and distributions. |
|
Select US cities by state for data from 1950-1999. Timeseries plots, climatologies and data distributions available for temperature(max,min) and precipitation. Some analysis and statistics available. |
|
| NCEP Operational Molde (FNL) Daily Data Plots |

|
Plot daily or daily averaged NCEP Operational Data. User can plot means, anomalies or climatology. Plotting options and regions can be specified. |
|
| Time-series: Monthly/Seasonal (ASCII) |

|
Obtain Monthly or seasonal time-series data and create plots from a subset of PSD's datasets |
|
| WRIT: Reanalysis Intercomparison Tools: Trajectory Calculation Tool |

|
Plot and compare monthly/seasonal composites from different reanalyses and observational datasets including 20th Century Reanalysis |
|
| Climate Change Web Portal |

|
Plot maps and timeseries of selected variables from the CMIP5 archive |
|
| Time-series: Daily Time Series Extraction from reanalyses |

|
Extract daily timeseries from several reanalysis datasets and climate indicies. Obtain highest/lowest values |
|
| Time-Series: Sub-Daily Time Series Extraction from Reanalyses |

|
Extract subdaily timeseries from several reanalysis datasets. Obtain highest/lowest values |
|
| ENSO Climate Impacts Comparisons |

|
Displays El Niño and La Niña averages of different climate variables for winter and summer and for the entire globe or just the US. |
|
| ENSO Climate Risks |

|
Displays historical seasonal United States temperature/precipitation odds during El Niño or La Niña events |
|
| EP Flux Plots and Animations from the NCEP/NCAR Reanalysis |

|
Plot EP Flux for a range of day(s)from the NCEP/NCAR Reanalysis and animate recent EP Flux values |
|
| Wavelet Analysis |

|
Calculates Wavelet analysis of ocean/atmosphere and user time-series. Choose interactive plot from main menu. Not hosted at PSD. |
|
| Distributions: Plot distributions of daily climate data |

|
Plot distributions and fit selected distribution models of daily data from reanalyses including the20th Century Reanalysis and observed datasets. |
|
| Plot Animator: Create custom animations |

|
Create custom animations from gridded datasets. |
|
| Climate Model Correlation Tool |

|
Correlate index timeseries with Climate Models |
|
| Climate Model Comparison for ENSO Events |

|
Plot and compare climate variables during ENSO events from different models and renalayes. |