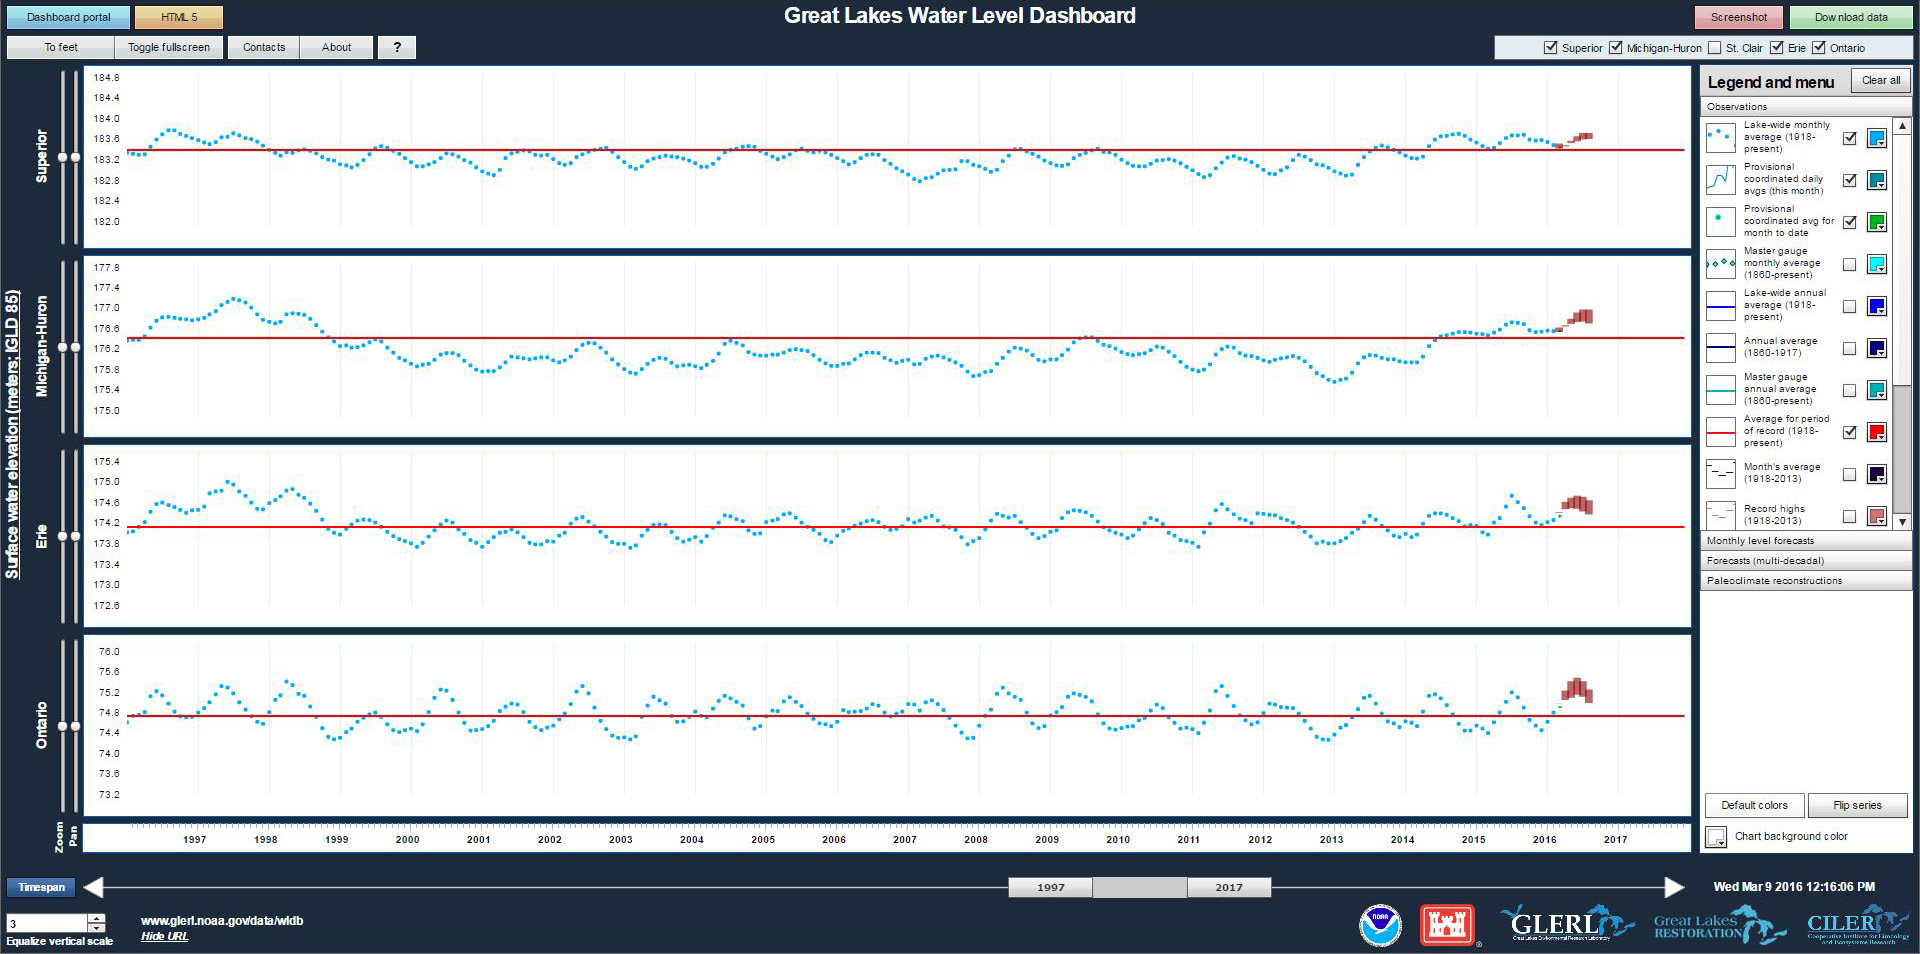
Great Lakes Water Level Dashboard
NOAA Great Lakes Environmental Research Laboratory
Overview
The dashboard was designed to provide access to and visualize monthly Great Lakes water level data and forecasts across a variety of time scales. The tool features a sliding time scale that makes it equally easy to view the past year or the past 150 years.
Features
- Obtain water level data visualizations for all the Great Lakes, enhancing the user’s understanding of water level fluctuations
- Access 150+ years of recorded data, paleoclimatic data, and long-term (to 2100) projections
- Access data and seasonal forecasts through a common platform
