The maps displayed below show how earthquake hazards vary across the United States. Hazards are measured as the likelihood of experiencing earthquake shaking of various intensities.
How to read the maps
The colors in the maps denote “seismic design categories” (SDCs), which reflect the likelihood of experiencing earthquake shaking of various intensities. (Building design and construction professionals use SDCs specified in building codes to determine the level of seismic resistance required for new buildings.)
The following table describes the hazard level associated with each SDC and the associated levels of shaking. Although stronger shaking is possible in each SDC, it is less probable than the shaking described.
| SDC | Map Color | Earthquake Hazard | Potential Effects of Shaking* |
|---|---|---|---|
| A | White | Very small probability of experiencing damaging earthquake effects. | |
| B | Gray | Could experience shaking of moderate intensity. | Moderate shaking—Felt by all, many frightened. Some heavy furniture moved; a few instances of fallen plaster. Damage slight. |
| C | Yellow | Could experience strong shaking. | Strong shaking—Damage negligible in buildings of good design and construction; slight to moderate in well-built ordinary structures; considerable damage in poorly built structures. |
| D0 | Light brown | Could experience very strong shaking (the darker the color, the stronger the shaking). | Very strong shaking—Damage slight in specially designed structures; considerable damage in ordinary substantial buildings with partial collapse. Damage great in poorly built structures. |
| D1 | Darker brown | ||
| D2 | Darkest brown | ||
| E | Red | Near major active faults capable of producing the most intense shaking. | Strongest shaking—Damage considerable in specially designed structures; frame structures thrown out of plumb. Damage great in substantial buildings, with partial collapse. Buildings shifted off foundations. Shaking intense enough to completely destroy buildings. |
| * Abbreviated descriptions from The Modified Mercalli Intensity Scale. | |||
SDCs take into account the type of soil at the site, as poor soils can significantly increase earthquake shaking. These maps have simplified this by assuming normal Site Class “D” soils, which are the most commonly found.
When viewing the maps, it is important to remember that areas with high earthquake hazards do not necessarily face high seismic risks. Defined as the losses that are likely to result from exposure to earthquake hazards, seismic risks are determined not only by hazard levels but also by the amount of people and property that are exposed to the hazards and by how vulnerable people and property are to the hazards. This is explained in more detail in Your Earthquake Risk.
Maps

SDC map of the Eastern United States for low-rise Occupancy Category I and II structures located on sites with average alluvial soil conditions.
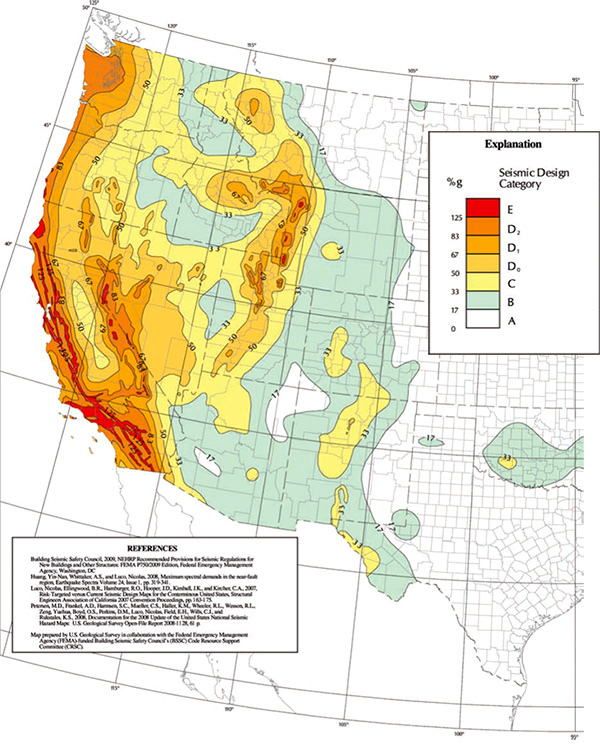
SDC map of the Western United States for low-rise Occupancy Category I and II structures located on sites with average alluvial soil conditions.

SDC map of Alaska for low-rise Occupancy Category I and II structures located on sites with average alluvial soil conditions.
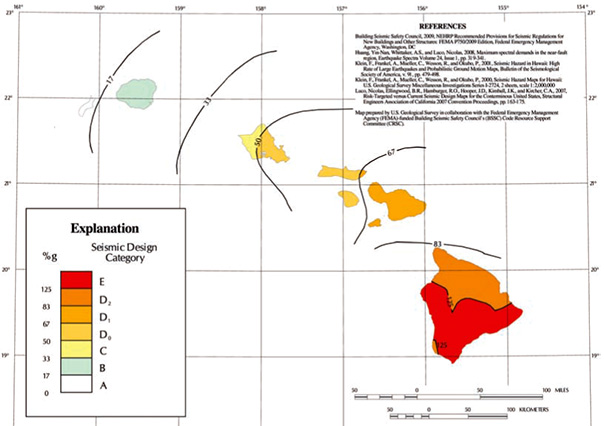
SDC map of Hawaii for low-rise Occupancy Category I and II structures located on sites with average alluvial soil conditions.
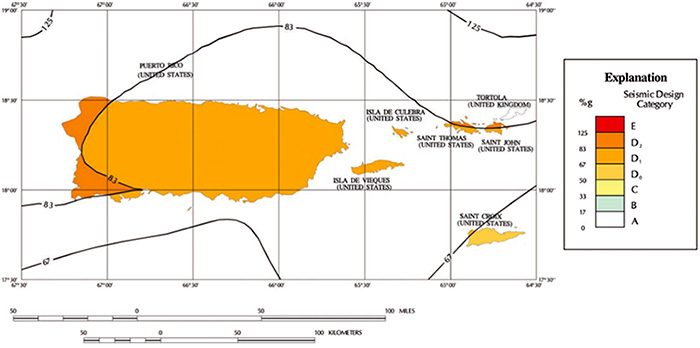
SDC map of Puerto Rico, the United States Virgin Islands and Tortola for low-rise Occupancy Category I and II structures located on sites with average alluvial soil conditions.
Data for building design professionals
The U.S. Geological Survey, in cooperation with FEMA and the Building Seismic Safety Council, has developed a web-based seismic design application for building designers. This program can be used to obtain the earthquake ground motion parameters needed to design structures for specific geographic locations in accordance with the latest building code reference documents. To access this application, as well as the seismic design maps on which it is based, go to U.S. Seismic Design Maps.