Short-Term Energy Outlook
Release Date: February 12, 2013 | Next Release Date: March 12, 2013 | Full Report | Text Only | All Tables | All Figures
Electricity
Natural gas supply constraints in New England were exacerbated by a late-January cold snap, which raised wholesale power prices in the New York Independent System Operator (ISO) and ISO New England (the regional transmission organizations that serve the northeastern United States). While short-term wholesale power price spikes rarely have visible effects on retail electricity rates, wholesale prices were likely high enough to make it economically attractive to use petroleum-fired power generation for a few days.
U.S. Electricity Consumption
U.S. residential electricity sales during December 2012 and January 2013 are estimated to have averaged 1.3 percent more than the same months a year ago. EIA is assuming that temperatures during the upcoming summer will be milder than last summer's record-breaking heat. U.S. cooling degree days during June, July, and August 2013 are expected to total about 13 percent lower than last summer and about 6 percent lower than the prior 10-year average. EIA projects U.S. residential sales of electricity during the upcoming summer will average 6 percent below the summer of 2012. Overall, U.S. residential electricity sales decline by 0.4 percent during 2013 but then grow by 0.4 percent in 2014.

U.S. Electricity Generation
EIA expects total generation of electricity across all sectors will grow by 0.5 percent in 2013 and by 0.8 percent in 2014. Generation from renewable energy sources other than hydropower exhibited the highest rate of growth among all generation sources in recent years, and similar growth is expected to continue during the next two years. EIA estimates that the electric power sector added over 12 gigawatts of new wind power capacity during 2012, about 40 percent of which came on line in December before the scheduled end-of-year deadline, which has been extended, for wind capacity to be operational in order to be eligible for the production tax credit. This additional capacity contributes to an expected 12-percent increase in generation from renewable sources other than hydropower during 2013. Nonhydro renewable energy accounts for 6.0 percent of total generation in 2013 and 6.4 percent in 2014, compared with 5.4 percent in 2012.
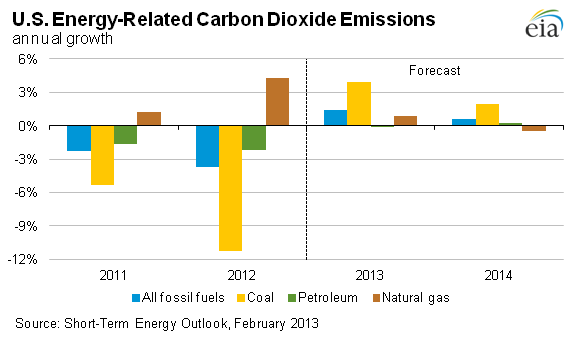
Because of the increasing cost of natural gas relative to coal, the share of electricity generated by natural gas is expected to fall from 30.3 percent in 2012 to 27.6 percent in 2014. EIA expects the share of generation fueled by coal to rise from 37.4 percent in 2012 to 39.1 percent in 2014.

U.S. Electricity Retail Prices
Rising costs of infrastructure upgrades continue to drive increases in residential electricity rates, although lower fuel prices in recent years have kept growth in retail rates relatively modest. After an increase of 1.3 percent during 2012, EIA expects retail residential electricity prices will grow by 1.7 percent in 2013 and by 2.0 percent in 2014.

| U.S. Electricity Summary | ||||
|---|---|---|---|---|
| 2011 | 2012 | 2013 projected | 2014 projected | |
| Retail Prices | (cents per kilowatthour) | |||
| Residential Sector | 11.72 | 11.87 | 12.07 | 12.32 |
| Commercial Sector | 10.23 | 10.11 | 10.21 | 10.39 |
| Industrial Sector | 6.82 | 6.69 | 6.80 | 6.93 |
| Power Generation Fuel Costs | (dollars per million Btu) | |||
| Coal | 2.39 | 2.40 | 2.41 | 2.45 |
| Natural Gas | 4.73 | 3.42 | 4.33 | 4.60 |
| Residual Fuel Oil | 18.30 | 20.70 | 17.19 | 17.12 |
| Distillate Fuel Oil | 22.43 | 23.43 | 23.77 | 23.35 |
| Generation | (billion kWh per day) | |||
| Coal | 4.749 | 4.145 | 4.349 | 4.388 |
| Natural Gas | 2.777 | 3.360 | 3.141 | 3.103 |
| Nuclear | 2.165 | 2.101 | 2.122 | 2.154 |
| Conventional Hydroelectric | 0.875 | 0.760 | 0.740 | 0.749 |
| Renewable (non-hydroelectric) | 0.532 | 0.596 | 0.667 | 0.717 |
| Total Generation | 11.235 | 11.078 | 11.134 | 11.227 |
| Retail Sales | (billion kWh per day) | |||
| Residential Sector | 3.90 | 3.76 | 3.75 | 3.76 |
| Commercial Sector | 3.64 | 3.62 | 3.63 | 3.67 |
| Industrial Sector | 2.72 | 2.68 | 2.71 | 2.74 |
| Total Retail Sales | 10.27 | 10.09 | 10.11 | 10.20 |
| Primary Assumptions | (percent change from previous year) | |||
| Real DIsposable Personal Income | 1.3 | 1.5 | 0.6 | 3.2 |
| Manufacturing Production Index | 4.8 | 4.4 | 1.5 | 3.4 |
| Cooling Degree Days | 2.0 | 0.7 | -13.8 | -0.0 |
| Heating Degree Days | -3.4 | -12.4 | 15.1 | 2.1 |
| Number of Households | 1.3 | 1.0 | 1.2 | 1.2 |
Interactive Data Viewers
Provides custom data views of historical and forecast data
STEO Custom Table Builder ›
Real Prices Viewer ›
| Related Articles | ||
|---|---|---|
| Today In Energy | Daily | |
| Annual Energy Outlook Electric Power Projections | Annual | |
| Annual Energy Outlook Levelized Generation Costs | Annual | |
| 2012-2013 Winter Fuels Outlook Slideshow | Oct-2012 | |
| Change in STEO Regional and U.S. Degree Day Calculations | Sep-2012 | |
| Changes to Electricity and Renewables Tables | Aug-2012 | |
| Fuel Competition in Power Generation | Jun-2012 |