
Foreign Trade
You are here: Census.gov › Business & Industry ›Foreign Trade › U.S. International Trade Data
U.S. International Trade Data
Latest U.S. International Trade in Goods and Services Report
|
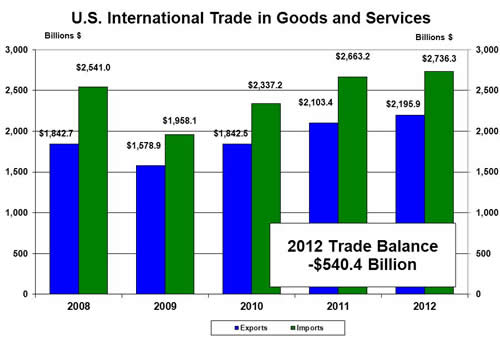
The Nation’s international trade deficit in goods and services decreased to $38.5 billion in December from $48.6 billion in November (revised), as exports increased and imports decreased. (February 8, 2013) |
December 2012 Trade Highlights | |
Visualize Trade |
|
Graph of the Month
December's first graph shows the annual totals for the top 5 countries importing automobiles (NAICS 3361). 2012 was a record high of automotive imports with $167 billion, an increase of 19% from 2011. As you can see, automotive imports have bounced back from the recession of 2009. Within the top 5 countries, Germany had the largest percentage increase of 106% when compared to 2009 and an increase of 20% compared to 2011. Japan, which had the largest decrease of 42% from 2008 to 2009 among the top 5, improved 58% from 2009 to 2012 and improved 26% from 2011 to 2012.
December's second graph shows the top country market share of annual U.S. automotive imports in 2012. To see the data points, hover your mouse over the graph. Using the interactive legend you may isolate the data by country by clicking on the respective countries icon in the legend. Download data [XLS]. You can obtain this data and more by going to USA Trade Online.
Recent News
- U.S. Trade Through Ports Affected by Hurricane Sandy PDF | XLS
- December 2012 Preliminary Steel Imports | Release schedule
- Notice: Changes to FT-900 Exhibit 15
- Notice: Accelerated Release Beginning with January 2013 Statistics
- Notice: Updated Revisions Policy for Goods on a Census Basis
- Notice: Discontinuance of the U.S. Imports of Softwood Lumber from Canada Report
- 2011 Annual Trade Revisions
- Related Party Trade, 2011
- A Profile of U.S. Importing and Exporting Companies, 2009-2010 | Highlights
- Notice: Changes to FT-920: Merchandise Trade Highlights
- New Interactive Concordance: Exports | Imports
- New State Import Data Series
- Notice of change to Low Value Estimates
- Aircraft
Industry Trade Data Changes
December 2012
Trade Numbers
Deficit: $38.5 Billion
Exports: $186.4 Billion
Imports: $224.9 Billion
Next release: March 7, 2013
Complete Release Schedule
Export Training Videos
A collection of videos to enhance export trainingUpcoming Seminars and Workshops
Export Compliance Program
San Diego, CA
Export Compliance Program
Phoenix, AZ
Contact Us
Contact the Foreign Trade Data Dissemination staff: Email us! or use our feedback form!
Call us: (301)763-2311 or 1-800-549-0595 option 4
 Email Updates
 Facebook
 Twitter
 Flickr
 YouTube