Maps and Data
Find maps and charts showing transportation data and trends related to alternative fuels and vehicles.
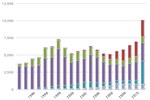
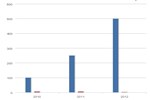
U.S. Ethanol Plants, Capacity, and Production
| 1999 | 2000 | 2001 | 2002 | 2003 | 2004 | 2005 | 2006 | 2007 | 2008 | 2009 | 2010 | 2011 | |
| Ethanol Plants | 54 | 56 | 61 | 68 | 72 | 81 | 95 | 110 | 139 | 170 | 189 | 204 | 209 |
| Capacity (BGY) | 1.7487000000000001 | 1.9219000000000002 | 2.3473 | 2.7068000000000003 | 3.1008 | 3.6437 | 4.336399999999999 | 5.493399999999999 | 7.8884 | 10.5694 | 11.8774 | 13.5079 | 14.9069 |
| Production (BGY) | 1.47 | 1.63 | 1.77 | 2.13 | 2.8 | 3.4 | 3.904 | 4.855 | 6.5 | 9 | 10.6 | 13.23 | 13.9 |
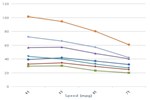
Notes: Production capacity listed as under expansion or under construction is not presented in this chart.
This chart shows the number of ethanol plants in the U.S. from 1999 through 2011. The capacity of these plants has been increasing at a faster rate than has the number of plants, meaning the average plant size is increasing. Production is remarkably close to plant capacity, especially considering that both are tracked at the end of each year, so plants built late in the year contribute largely towards capacity but only partially toward production.