Maps and Data
Find maps and charts showing transportation data and trends related to alternative fuels and vehicles.
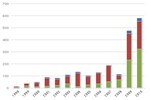
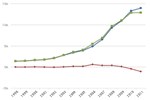
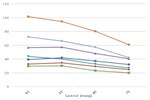
U.S. Corn Productivity and Land Use
| 1866 | 1867 | 1868 | 1869 | 1870 | 1871 | 1872 | 1873 | 1874 | 1875 | 1876 | 1877 | 1878 | 1879 | 1880 | 1881 | 1882 | 1883 | 1884 | 1885 | 1886 | 1887 | 1888 | 1889 | 1890 | 1891 | 1892 | 1893 | 1894 | 1895 | 1896 | 1897 | 1898 | 1899 | 1900 | 1901 | 1902 | 1903 | 1904 | 1905 | 1906 | 1907 | 1908 | 1909 | 1910 | 1911 | 1912 | 1913 | 1914 | 1915 | 1916 | 1917 | 1918 | 1919 | 1920 | 1921 | 1922 | 1923 | 1924 | 1925 | 1926 | 1927 | 1928 | 1929 | 1930 | 1931 | 1932 | 1933 | 1934 | 1935 | 1936 | 1937 | 1938 | 1939 | 1940 | 1941 | 1942 | 1943 | 1944 | 1945 | 1946 | 1947 | 1948 | 1949 | 1950 | 1951 | 1952 | 1953 | 1954 | 1955 | 1956 | 1957 | 1958 | 1959 | 1960 | 1961 | 1962 | 1963 | 1964 | 1965 | 1966 | 1967 | 1968 | 1969 | 1970 | 1971 | 1972 | 1973 | 1974 | 1975 | 1976 | 1977 | 1978 | 1979 | 1980 | 1981 | 1982 | 1983 | 1984 | 1985 | 1986 | 1987 | 1988 | 1989 | 1990 | 1991 | 1992 | 1993 | 1994 | 1995 | 1996 | 1997 | 1998 | 1999 | 2000 | 2001 | 2002 | 2003 | 2004 | 2005 | 2006 | 2007 | 2008 | 2009 | 2010 | 2011 | |
| Acres Harvested (millions) | 30.017 | 32.116 | 35.116 | 35.833 | 38.388 | 42.002 | 43.584 | 44.084 | 47.64 | 52.446 | 55.277 | 58.799 | 59.659 | 62.229 | 62.545 | 63.026 | 66.157 | 68.168 | 68.834 | 71.854 | 73.911 | 73.296 | 77.474 | 77.656 | 74.785 | 78.855 | 76.914 | 79.832 | 80.069 | 90.479 | 89.074 | 89.965 | 87.784 | 94.591 | 94.852 | 94.422 | 97.177 | 93.555 | 95.228 | 95.746 | 95.624 | 96.094 | 95.285 | 100.2 | 102.267 | 101.393 | 101.451 | 100.206 | 97.796 | 100.623 | 100.561 | 110.893 | 102.195 | 87.487 | 90.149 | 91.939 | 84.858 | 87.493 | 84.119 | 86.825 | 83.275 | 83.915 | 85.832 | 83.194 | 85.525 | 91.131 | 97.213 | 92.13 | 61.245 | 82.551 | 67.833 | 81.222 | 82.788 | 78.307 | 76.443 | 77.404 | 79.213 | 81.906 | 85.002 | 77.928 | 78.41 | 73.802 | 76.84 | 77.106 | 72.398 | 71.191 | 71.353 | 70.738 | 68.668 | 68.462 | 64.877 | 63.065 | 63.549 | 72.091 | 71.422 | 57.634 | 55.726 | 59.227 | 55.369 | 55.392 | 57.002 | 60.694 | 55.98 | 54.574 | 57.358 | 64.123 | 57.513 | 62.143 | 65.405 | 67.625 | 71.506 | 71.614 | 71.93 | 72.4 | 72.961 | 74.524 | 72.719 | 51.479 | 71.897 | 75.209 | 68.907 | 59.505 | 58.25 | 64.783 | 66.952 | 68.822 | 72.077 | 62.933 | 72.514 | 65.21 | 72.644 | 72.671 | 72.589 | 70.487 | 72.44 | 68.768 | 69.33 | 70.944 | 73.631 | 75.117 | 70.638 | 86.52 | 78.64 | 79.294 | 81.446 | 83.981 |
| Yield (bushels per acre) | 24.3 | 24.7 | 26.2 | 21.8 | 29.3 | 27.2 | 29.4 | 22.9 | 22.2 | 27.7 | 26.7 | 25.8 | 26.2 | 28.2 | 27.3 | 19.8 | 26.5 | 24.2 | 28.3 | 28.6 | 24.1 | 21.9 | 29.1 | 29.5 | 22.1 | 29.6 | 24.7 | 23.8 | 20.2 | 28 | 30 | 25.4 | 26.8 | 28 | 28.1 | 18.2 | 28.5 | 26.9 | 28.2 | 30.9 | 31.7 | 27.2 | 26.9 | 26.1 | 27.9 | 24.4 | 29.1 | 22.7 | 25.8 | 28.1 | 24.1 | 26.2 | 23.9 | 26.8 | 29.9 | 27.8 | 26.3 | 27.8 | 22.1 | 27.4 | 25.7 | 26.4 | 26.3 | 25.7 | 20.5 | 24.5 | 26.5 | 22.8 | 18.7 | 24.2 | 18.6 | 28.9 | 27.8 | 29.9 | 28.9 | 31.2 | 35.4 | 32.6 | 33 | 33.1 | 37.2 | 28.6 | 43 | 38.2 | 38.2 | 36.9 | 41.8 | 40.7 | 39.4 | 42 | 47.4 | 48.3 | 52.8 | 53.1 | 54.7 | 62.4 | 64.7 | 67.9 | 62.9 | 74.1 | 73.1 | 80.1 | 79.5 | 85.9 | 72.4 | 88.1 | 97 | 91.3 | 71.9 | 86.4 | 88 | 90.8 | 101 | 109.5 | 91 | 108.9 | 113.2 | 81.1 | 106.7 | 118 | 119.4 | 119.8 | 84.6 | 116.3 | 118.5 | 108.6 | 131.5 | 100.7 | 138.6 | 113.5 | 127.1 | 126.7 | 134.4 | 133.8 | 136.9 | 138.2 | 129.3 | 142.2 | 160.3 | 147.9 | 149.1 | 150.7 | 153.9 | 164.2 | 152.8 | 147.2 |
Source: USDA National Agricultural Statistical Service database query.
This chart shows average corn yield per acre and total harvested acres of corn in the United States between 1867 and 2011. In the 1920s, modern agricultural advances began to push corn yields upward, increasing the number of bushels produced on each acre of land. This has allowed total cultivated acreage decline or stabilize, even as population has increased. Ethanol production has brought many of these acres back into agricultural production in recent years, but because land is much more productive now, there are still many fewer acres harvested than at the turn of the last century.