Maps and Data
Find maps and charts showing transportation data and trends related to alternative fuels and vehicles.
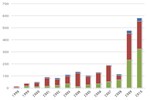
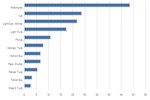
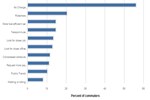
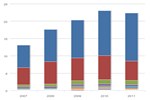
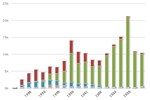
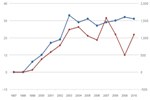
Light-Duty AFV, HEV, and Diesel Model Offerings, By Fuel Type
| 1991 | 1992 | 1993 | 1994 | 1995 | 1996 | 1997 | 1998 | 1999 | 2000 | 2001 | 2002 | 2003 | 2004 | 2005 | 2006 | 2007 | 2008 | 2009 | 2010 | 2011 | 2012 | |
| E85 | 0 | 1 | 1 | 1 | 0 | 1 | 1 | 2 | 6 | 8 | 11 | 16 | 22 | 19 | 24 | 22 | 31 | 31 | 36 | 34 | 72 | 62 |
| CNG (Dedicated and Bi-Fuel) | 0 | 2 | 2 | 2 | 10 | 10 | 9 | 12 | 16 | 15 | 16 | 18 | 16 | 16 | 5 | 5 | 1 | 1 | 1 | 1 | 1 | 6 |
| Diesel | 17 | 14 | 5 | 12 | 13 | 12 | 11 | 11 | 7 | 3 | 3 | 4 | 4 | 7 | 8 | 6 | 7 | 6 | 12 | 14 | 16 | 17 |
| Electric Vehicle* | 0 | 0 | 0 | 0 | 1 | 0 | 3 | 8 | 16 | 12 | 10 | 6 | 5 | 1 | 0 | 0 | 0 | 1 | 1 | 1 | 2 | 6 |
| Hybrid | 0 | 0 | 0 | 0 | 0 | 0 | 0 | 0 | 0 | 2 | 2 | 3 | 3 | 3 | 8 | 8 | 11 | 16 | 19 | 20 | 29 | 31 |
| Propane (Dedicated and Bi-Fuel) | 0 | 0 | 0 | 0 | 0 | 0 | 3 | 3 | 5 | 2 | 5 | 5 | 1 | 1 | 0 | 0 | 0 | 1 | 1 | 0 | 0 | 1 |
| Methanol (M85) | 2 | 2 | 4 | 2 | 2 | 1 | 1 |
Source: National Renewable Energy Laboratory
Notes: *EVs do not include neighborhood electric vehicles (NEVs), low speed electric vehicles, or two-wheeled electric vehicles.
This chart shows the number of light-duty alternative fuel vehicles (AFVs), hybrid electric vehicles (HEVs), and diesel models offered by vehicle manufacturers from 1991 through 2012. In 2012, vehicles capable of using E85 represent the largest share of models offered. This is largely because the technology required for E85 vehicles is comparatively inexpensive and compatible with gasoline vehicles.
Conversion models were counted for natural gas and propane vehicles for the first time in 2012.