Maps and Data
Find maps and charts showing transportation data and trends related to alternative fuels and vehicles.
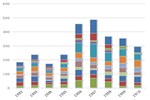
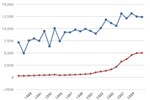
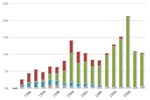
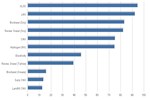
Global Ethanol Production
| 2007 | 2008 | 2009 | 2010 | 2011 | |
| USA | 6.485 | 9.235 | 10.935 | 13 | 13.9 |
| Brazil | 5.0192 | 6.4722 | 6.578 | 6.92154 | 5.57324 |
| Europe | 0.5702999999999999 | 0.7336 | 1.04 | 1.20858 | 1.16764 |
| China | 0.486 | 0.5019 | 0.542 | 0.54155 | 0.55476 |
| Canada | 0.21130000000000002 | 0.2377 | 0.291 | 0.35663 | 0.4623 |
| Asia (minus China) | 0.132 | 0.15580000000000002 | 0.527 | 0.24436000000000002 | 0.33494000000000007 |
| South America (minus Brazil) | 0.07490000000000001 | 0.0792 | 0.083 | 0.20022000000000026 | 0.19865999999999986 |
| Mexico & Central America | 0.3643599999999998 | 0.03904000000000014 | |||
| Australia | 0.0264 | 0.0264 | 0.057 | 0.06604 | 0.0872 |
| Africa | 0.043590000000000004 | 0.038310000000000004 | |||
| Other | 0.082 | 0.128 | 0.247 | 0.06604 |
Source: F.O. Licht, cited in Renewable Fuels Association, Ethanol Industry Outlook 2008-2012 reports.
This chart shows global ethanol production by country or region, from 2007 to 2011. Global production steadily increased through 2010 and then slightly dropped in 2011. The United States is the world's largest producer of ethanol, having produced nearly 14 billion gallons in 2011 alone. Together, the U.S. and Brazil produce 87% of the world's ethanol. The vast majority of U.S. ethanol is produced from corn, while Brazil primarily uses sugar.