Maps and Data
Find maps and charts showing transportation data and trends related to alternative fuels and vehicles.
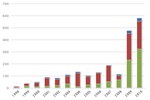
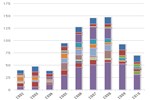
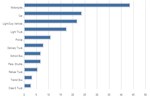
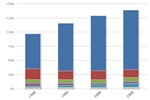
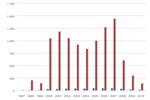
AFV and HEV Model Offerings, By Manufacturer
| 1991 | 1992 | 1993 | 1994 | 1995 | 1996 | 1997 | 1998 | 1999 | 2000 | 2001 | 2002 | 2003 | 2004 | 2005 | 2006 | 2007 | 2008 | 2009 | 2010 | 2011 | 2012 | |
| Bentley | 3 | 3 | ||||||||||||||||||||
| BMW | 1 | 3 | 1 | |||||||||||||||||||
| Chrysler | 2 | 2 | 3 | 8 | 6 | 0 | 1 | 7 | 7 | 9 | 8 | 10 | 3 | 5 | 6 | 10 | 10 | 10 | 5 | 11 | 3 | |
| Ford | 1 | 1 | 2 | 2 | 5 | 6 | 14 | 13 | 19 | 12 | 11 | 13 | 14 | 14 | 7 | 8 | 6 | 8 | 7 | 14 | 18 | 18 |
| GM | 1 | 2 | 3 | 0 | 0 | 0 | 3 | 7 | 7 | 11 | 12 | 13 | 13 | 15 | 13 | 15 | 17 | 18 | 17 | 17 | 25 | 12 |
| Honda | 2 | 2 | 2 | 2 | 3 | 3 | 3 | 4 | 4 | 3 | 3 | 3 | 4 | 5 | 5 | |||||||
| Hyundai | 1 | 1 | ||||||||||||||||||||
| Lexus | 3 | 5 | 5 | |||||||||||||||||||
| Mazda | 1 | 1 | 1 | 1 | 1 | 1 | 1 | 3 | 1 | 1 | ||||||||||||
| Mercedes | 1 | 3 | 5 | 1 | 1 | 1 | 3 | 3 | 3 | |||||||||||||
| Mitsubishi | 1 | 1 | ||||||||||||||||||||
| Nissan | 1 | 1 | 2 | 2 | 2 | 1 | 1 | 3 | 3 | 3 | 3 | 4 | 4 | |||||||||
| Tesla | 1 | 1 | ||||||||||||||||||||
| Toyota | 2 | 2 | 3 | 4 | 3 | 2 | 1 | 2 | 3 | 5 | 6 | 4 | 5 | 5 | 8 | |||||||
| Volkswagon | 1 | 2 |
Source: National Renewable Energy Laboratory
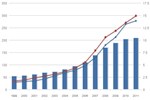
This chart shows the number of models of light-duty alternative fuel vehicles (AFVs) and hybrid electric vehicles (HEVs), broken down by manufacturer, offered by original equipment manufacturers from 1991 through 2012. The number of models has increased relatively steadily over the period shown. GM, Ford, and Chrysler dominate the offerings in all years, primarily because of the many models of flex-fuel vehicles they offer.