Maps and Data
Find maps and charts showing transportation data and trends related to alternative fuels and vehicles.
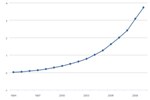
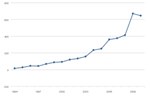
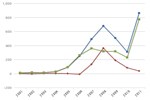
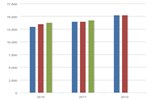
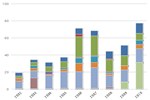
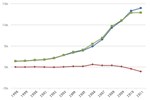
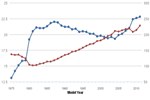
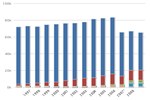
U.S. Production, Consumption, and Trade of Ethanol
| 1998 | 1999 | 2000 | 2001 | 2002 | 2003 | 2004 | 2005 | 2006 | 2007 | 2008 | 2009 | 2010 | 2011 | |
| Production | 1405.026 | 1465.002 | 1622.334 | 1765.176 | 2140.152 | 2804.424 | 3404.436 | 3904.362 | 4884 | 6521 | 9309 | 10938 | 13298 | 13948 |
| Net Increase* | -17.43 | -22.302 | 31.08 | -24.486 | -67.032 | 21.588 | 147.756 | 154.266 | 597 | 365 | 374 | 99 | -440 | -1077 |
| Consumption | 1387.596 | 1442.7 | 1653.414 | 1740.69 | 2073.12 | 2826.012 | 3552.192 | 4058.628 | 5481 | 6886 | 9683 | 11037 | 12858 | 12871 |
Source: EIA Annual Energy Review, 2011 Table 10.3 from the U.S. Energy Information Administration
Notes: *Net Increase through Imports and Stock Change
This chart shows the trend in total ethanol fuel production and consumption from 1998 to 2011. Use of ethanol as a gasoline additive has been increasing steadily during the past two decades. Its use was spurred by the Clean Air Act Amendments of 1990 (and subsequent laws), which mandated the sale of oxygenated fuels in areas with unhealthy levels of carbon monoxide. Today, E10 (an ethanol-gasoline blend containing 10 percent ethanol) is sold in all 50 states in order to boost octane, meet air quality requirements, or satisfy the Renewable Fuel Standard. Increases in ethanol use are also partly due to more widespread availability of flex-fuel vehicles, which can use blends as high as E85, and greater availability of E85 stations. The vast majority of ethanol used as vehicle fuel in the United States is produced domestically; the United States is the world's No. 1 ethanol producer, by volume.