Greenland Ice Sheet Today
NSIDC DAAC recently released a new website "Greenland Ice Sheet Today". The site offers daily satellite images and plots of surface melt, and periodic scientific analysis on Greenland Ice Sheet surface melting.
NSIDC DAAC recently released a new website "Greenland Ice Sheet Today". The site offers daily satellite images and plots of surface melt, and periodic scientific analysis on Greenland Ice Sheet surface melting.

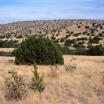
DAAC Image of the Week - Featured Data set: LBA Proportion Area Cultivated, 1995
5-minute land use maps showing the estimated total amount of cropland and pasture (natural and planted) for the Amazon and Tocantins River basins in Amazonia in 1995 and 1980 from ORNL DAAC. Data are provided in the netCDF format and the ARC/INFO GRID format and are suitable for use in models or other similar purposes.
5-minute land use maps showing the estimated total amount of cropland and pasture (natural and planted) for the Amazon and Tocantins River basins in Amazonia in 1995 and 1980 from ORNL DAAC. Data are provided in the netCDF format and the ARC/INFO GRID format and are suitable for use in models or other similar purposes.

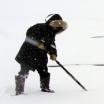
Snow across northeastern United States
Pictured on February 10, 2013, from Terra/MODIS. Visit LANCE for more near real-time data products from EOSDIS
Pictured on February 10, 2013, from Terra/MODIS. Visit LANCE for more near real-time data products from EOSDIS

SEDAC Map of the Week - Global Population Density
Map showing the Global Population Density. Taken from the collection at SEDAC. Visit the SEDAC Map Gallery for more mapping products from EOSDIS.
Map showing the Global Population Density. Taken from the collection at SEDAC. Visit the SEDAC Map Gallery for more mapping products from EOSDIS.

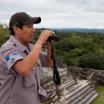
Orbiting Watchtowers
FIRMS fire alerts currently help natural resource managers, policy makers, and scientists protect forests from slash and burn farming, and other causes of fire, in over 120 countries. FIRMS distributes fire data from the MODIS instrument on board NASA's Aqua and Terra satellites.
FIRMS fire alerts currently help natural resource managers, policy makers, and scientists protect forests from slash and burn farming, and other causes of fire, in over 120 countries. FIRMS distributes fire data from the MODIS instrument on board NASA's Aqua and Terra satellites.