Maps and Data
Find maps and charts showing transportation data and trends related to alternative fuels and vehicles.
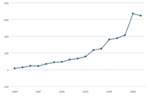
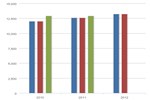
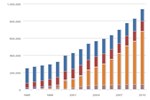
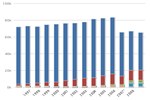
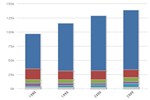
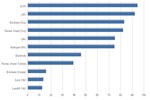
Biodiesel Purchases by EPAct-Regulated Fleets
| 1999 | 2000 | 2001 | 2002 | 2003 | 2004 | 2005 | 2006 | 2007 | 2008 | 2009 | 2010 | |
| Fuel Provider | 0.073498 | 0.3287 | 0.622942 | 1.338747 | 1.250302 | 1.61509 | 2.059643 | 3.047855 | 2.390838 | 3.126348 | 3.187327 | 1.919208 |
| State | 0.010155 | 0.029547 | 0.31725 | 0.775041 | 0.936616 | 0.865485 | 1.324604 | 2.140564 | 2.107977 | 3.183212 | 2.471265 | 3.658164 |
Notes: This chart shows only the amount of biodiesel that fleets reported to DOE. Because fleets may earn only some of their needed acquisition credits by using biodiesel, they typically only report the portion for which they can earn credit.
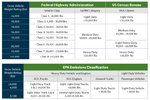
Under the Energy Policy Act of 1992 (EPAct) and subsequent regulations, certain vehicle fleets operated by state agencies or alternative fuel providers are required to acquire alternative fuel vehicles. Covered fleets may also meet some of their requirements by using biodiesel blends of 20% (B20) or higher in medium- or heavy-duty vehicles. This chart shows the amount of biodiesel purchased by covered fleets from 1999 to 2010.