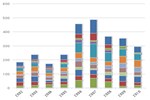
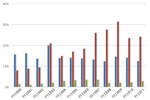
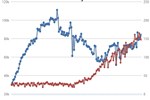
Maps and Data
Find maps and charts showing transportation data and trends related to alternative fuels and vehicles.
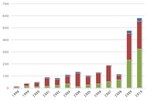
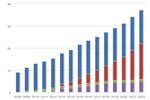
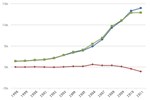
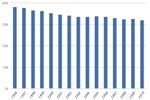
Annual Vehicle Miles Traveled in the U.S.
| 1987 | 1988 | 1989 | 1990 | 1991 | 1992 | 1993 | 1994 | 1995 | 1996 | 1997 | 1998 | 1999 | 2000 | 2001 | 2002 | 2003 | 2004 | 2005 | 2006 | 2007 | 2008 | 2009 | 2010 | 2011 | 2012 | |
| Thousand Miles | 1.857631 | 1.939041 | 2.041441 | 2.117716 | 2.141582 | 2.18883 | 2.25382 | 2.297939 | 2.38672 | 2.417911 | 2.496251 | 2.570334 | 2.626392 | 2.697095 | 2.754784 | 2.808501 | 2.854268 | 2.90417 | 2.972672 | 2.999419 | 3.01336 | 3.033301 | 2.964202 | 2.944963 | 2.968949 | 2.93802 |
Source: Federal Highway Administration
Notes: VMT counts include those of light-, medium-, and heavy-duty vehicles.
This chart shows trends in total vehicle miles traveled in the United States (expressed as a moving 12-month count) from 1987 through 2012. The long rise in the number of vehicle miles traveled, which began in 1979, finally reversed in 2008 due to the oil price spike that year.