Maps and Data
Find maps and charts showing transportation data and trends related to alternative fuels and vehicles.
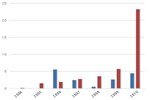
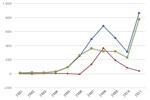
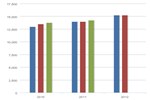
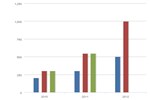
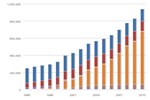
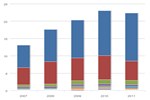
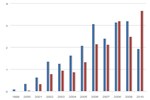
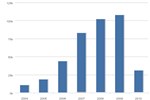
Incentive and Law Additions by Fuel/Technology Type
| 2002 | 2003 | 2004 | 2005 | 2006 | 2007 | 2008 | 2009 | 2010 | 2011 | |
| Biodiesel | 28 | 35 | 25 | 37 | 74 | 97 | 59 | 57 | 43 | 39 |
| Blends | 6 | 8 | 9 | 18 | 30 | 51 | 26 | [object Object] | [object Object] | [object Object] |
| Efficiency | 0 | 6 | 4 | 6 | 9 | 8 | 13 | 18 | 9 | 9 |
| Emissions | 6 | 8 | 12 | 4 | 23 | 16 | 16 | [object Object] | [object Object] | [object Object] |
| Ethanol | 25 | 29 | 17 | 30 | 70 | 98 | 65 | 52 | 44 | 42 |
| Electric Vehicles | 24 | 34 | 21 | 26 | 40 | 32 | 28 | 50 | 51 | 64 |
| Hybrid Electric Vehicles | 4 | 8 | 10 | 15 | 19 | 18 | 24 | 33 | 33 | 47 |
| Hydrogen | 22 | 24 | 18 | 18 | 44 | 28 | 23 | 34 | 24 | 20 |
| Idle Reduction | 2 | 4 | 16 | 18 | 10 | 20 | 23 | 9 | 9 | |
| Natural Gas | 28 | 38 | 16 | 23 | 45 | 32 | 27 | 40 | 43 | 34 |
| Propane | 27 | 27 | 14 | 21 | 30 | 27 | 22 | 33 | 20 | 25 |
| Other | 12 | 16 | 21 | 22 | 53 | 67 | 42 | 11 | 16 | 6 |
Source: National Renewable Energy Laboratory
Notes: Additions mean any incentive or law that were added to the AFDC, which is usually the same year that they were enacted or brought into force. This count includes legislation that has since expired.
This chart shows trends in incentives and laws related to alternative fuels and advanced vehicles, enacted in all 50 states and the District of Columbia from 2002 to 2011. Visit the Incentives and Laws page for information on federal and state incentives and laws.
Because a regulation may apply to more than one technology type, adding the totals for each row results in counting some regulations multiple times.
After 2008, the "Emissions" category was moved to "Other," and the Blends incentives were moved to the Ethanol or Biodiesel categories.