Maps and Data
Find maps and charts showing transportation data and trends related to alternative fuels and vehicles.
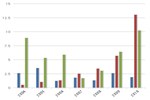
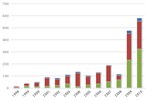
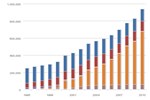
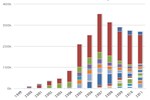
U.S. Total Corn Production and Corn Used for Fuel Ethanol Production
| 1987 | 1988 | 1989 | 1990 | 1991 | 1992 | 1993 | 1994 | 1995 | 1996 | 1997 | 1998 | 1999 | 2000 | 2001 | 2002 | 2003 | 2004 | 2005 | 2006 | 2007 | 2008 | 2009 | 2010 | 2011 | |
| Production | 7.1313 | 4.928680999999999 | 7.531953000000001 | 7.9340280000000005 | 7.4747650000000005 | 9.476698 | 6.33773 | 10.05052 | 7.400051 | 9.232557 | 9.206832 | 9.758685 | 9.430612 | 9.915051 | 9.50258 | 8.966787 | 10.089222 | 11.807086 | 11.114082 | 10.534868000000001 | 13.074 | 12.091 | 13.091 | 12.446 | 12.358 |
| Used for Ethanol | 0.279146 | 0.287445 | 0.321446 | 0.349068 | 0.398264 | 0.42551 | 0.458259 | 0.532793 | 0.39568000000000003 | 0.428721 | 0.481113 | 0.5257999999999999 | 0.565763 | 0.627593 | 0.7059460000000001 | 0.9955040000000001 | 1.167548 | 1.32307 | 1.6027799999999999 | 2.117085 | 3.2 | 3.708 | 4.568 | 4.95 | 5 |
Source: USDA's National Agriculture Statistics Service database query
This chart shows total U.S. corn production and corn used to produce fuel ethanol from 1987 to 2011. Although corn production fluctuates from year to year, the overall trend has been one of increasing production. The amount of corn used for ethanol production increased substantially during the last decade, owing primarily to federal laws and incentives that aim to increase energy security and reduce vehicle emissions. The amount of corn not used for ethanol is about the same now as it was in the late 1980s and early 1990s.