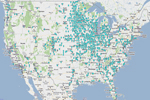
Maps and Data
Find maps and charts showing transportation data and trends related to alternative fuels and vehicles.
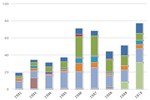
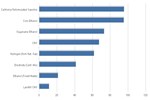
Clean Cities Petroleum Savings by Idle Reduction
| 2004 | 2005 | 2006 | 2007 | 2008 | 2009 | 2010 | 2011 | |
| Truck-stop Electrification | 2.6 | 3.5 | 1.2 | 1.8 | 1.3 | 2.6 | 1.9 | 2.5 |
| On-board IR | 0.5 | 1 | 1.3 | 2.5 | 3.4 | 5.7 | 13 | 16.4 |
| IR Policies | 8.9 | 5.3 | 5.9 | 1.7 | 3 | 6.4 | 10.2 | 13.3 |
Source: Clean Cities annual metrics reports, 2004-2011.
Notes: Savings are measured in gasoline-gallon equivalents (GGEs), representing a quantity of fuel with the same amount of energy contained in a gallon of gasoline.
This chart shows Clean Cities petroleum savings by various idle-reduction (IR) measures from 2004 through 2011.