CU Home | CIRES Home | People | Maps
![]()
![]()
![]()

Intermountain West Climate Dashboard
The Intermountain West Climate Dashboard provides an array of climate and water graphics for Colorado, Utah, and Wyoming that are automatically updated as often as the original providers post them on their respective websites (the update frequency is listed under each graphic). We also post text briefings once per month based on the climate graphics. Note: the text in the latest briefing may not be fully consistent with the climate graphics in the Dashboard, depending on the weather and updates in the graphics since that briefing was posted.
Click on any graphic to view a full-sized version, and click again to reduce it. You can enlarge multiple graphics at the same time, and click-drag to move them around your desktop.
The name of each graphic below is linked to the page for that graphic at the provider's website.
See this page for detailed descriptions of all of the Dashboard graphics, or click the
above each graphic to see the description of that graphic.
Also please visit the new Rocky Mountain–High Plains Climate Dashboard, which covers an eight-state region: Montana, Wyoming, Utah, Colorado, North Dakota, South Dakota, Nebraska, and Kansas.
If you have suggestions for the Dashboard, please contact us.
Skip down to the briefings (Latest briefing: January 9)
Recent Temperatures and Precipitation, and Current Snowpack
| 30-day Precip as % Avg (HPRCC) (updated daily)
|
|
|||||||||
Drought Monitoring |
||||||||||
| State Drought Monitors (NDMC) |
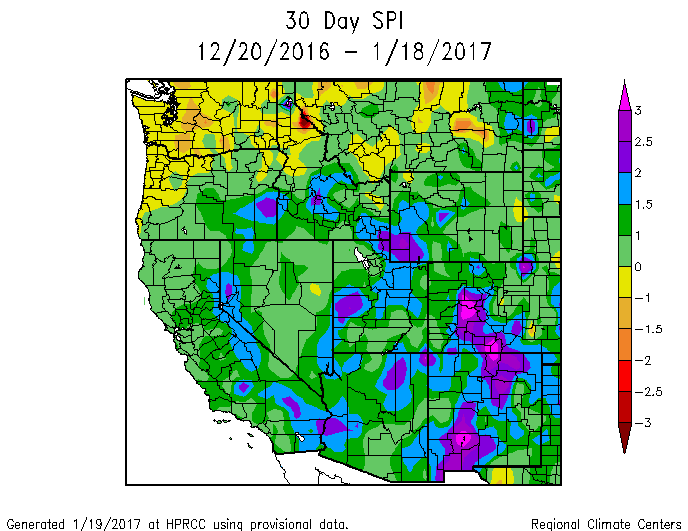
Standardized Precip Index (SPI) (HPRCC)
 |
Evaporative Demand Drought Index (EDDI) (NOAA ESRL PSD, WWA, and DRI) (updated daily) |
||||||||
 Colorado Colorado |
2-wk  |
4-wk  |
||||||||
 Utah Utah |
3-month  |
8-wk  |
12-wk  |
|||||||
 Wyoming Wyoming |
12-month  |
6-mo |
12-mo  |
|||||||
Current Streamflow, Forecasted Streamflow |
||||||||||
| Current Streamflow - CO (USGS) (updated daily) |
Current Streamflow - UT (USGS)  (updated daily) (updated daily) |
Current Streamflow - WY (USGS) (updated daily) |
||||||||
 |
||||||||||
|
||||||||||
| Monthly & Seasonal Climate Outlooks (NOAA CPC)
|
||||||||||
Precipitation and Snow Forecasts, Drought Outlook |
||||||||||
 |
||||||||||
ENSO Conditions & Forecasts |
||||||||||
 |
ENSO Prediction Plume (forecasts of Nino 3.4 SST) (IRI) |
|||||||||


Latest Monthly Briefing - January 9, 2017
-
Snowpack conditions have completely turned around after a grim start. A major storm kicked off the new year, and as of January 9 nearly all basins across the region have above-median SWE, with most basins at 120-170% of median
 . The snowpack across Colorado, Utah, and Wyoming for the date appears to be the 3rd-highest in the past 25 years, after 1997 and 2011.
 -
The January 1 NRCS spring-summer runoff forecasts call for near-average to much-above-average runoff across the region
 , with the highest runoff expected in Utah and western Wyoming. Note that these forecasts do not incorporate the most recent snowfall.
-
Nearly all of the region was wetter than normal in December, with many areas seeing over 200% of normal precipitation
 . Statewide, Wyoming was in the 96th percentile for precipitation, Colorado was in the 90th percentile, while Utah was in the 88th percentile.
-
There was a strong north-south gradient in temperature anomalies in December
 , with southern and eastern Utah and western Colorado warmer than normal, while much of Wyoming was 6-12°F below normal for the month.
-
Since early December there has been improvement in drought conditions, mainly from D0 to drought-free, in western Colorado, eastern Utah, and northern Wyoming
 . The proportion of the region in D1 or D2 conditions has held steady, with 37% of Colorado, 13% of Utah, and 16% of Wyoming.
 -
Weak La Niña conditions are persisting, barely, in the tropical Pacific
 . The ENSO forecast models now more strongly favor a return to ENSO-neutral conditions by late winter/early spring
  . NOAA CPC seasonal forecasts show a La Niña-esque wet tilt in the odds for Wyoming over the next 3-4 months
 .
.
Previous Briefings
December 8, 2016
-
November was drier than normal for most of the region, with wetter spots in central and southern Wyoming, southern Utah, and eastern Colorado. Statewide, Wyoming was in the 32nd percentile for precipitation, Colorado was in the 39th percentile, while Utah was in the 52nd percentile.
-
November continued what has been an extremely warm fall season, with most of the region coming in at 4-8°F above normal for the month. Colorado, Utah, and Wyoming each had their 3rd-warmest November on record.
-
Since early November, there has been some additional degradation of drought conditions in eastern Colorado and southern and eastern Wyoming. Colorado has D1 or D2 conditions over 38% of the state, compared to 15% in Utah and 14% in Wyoming.
-
The pattern change in mid-November finally opened the door to more storms and a big boost in snowpack conditions. As of December 8, most basins across the region have 55-80% of median SWE. Central and southern Utah and northeastern Wyoming have near- or above-normal SWE.
-
Weak La Niña conditions are just hanging on in the tropical Pacific. The ENSO forecast models are now tipped towards a return to ENSO-neutral conditions by late winter. NOAA CPC seasonal forecasts show a wet tilt in the odds for Wyoming over the next three months.
November 14, 2016
-
October saw a sharp gradient in precipitation across the region: all of Colorado, nearly all of Utah, and eastern Wyoming were much drier than normal, while far northern Utah and western Wyoming were much wetter than normal. Statewide, Colorado was in the 8th percentile for precipitation, while Utah was in the 25th percentile, and Wyoming was in the 84th percentile.
-
October was unusually warm across the region, as persistent ridging kept colder air at bay. For Colorado statewide, it was the 3rd-warmest October on record (98th percentile), 5.2°F above normal, with Utah (94th percentile) and Wyoming (92nd percentile) just behind.
-
Since early October, abnormally dry (D0) and moderate drought (D1) conditions have dramatically expanded in Colorado, from 24% of the state to 98% of the state, and in adjacent areas of southern Wyoming and eastern Utah. Drought conditions have eased in northwestern Wyoming.
-
The very warm and dry weather has stifled the accumulation of snow in the high country, with most basins having less than 25% of median SWE for November 14, and only a few basins having more than 50% of median SWE. The regional snowpack to date is the lowest since 1999–2000, though the vast majority of seasonal snow accumulation does occur after mid-November.
-
On November 10, NOAA finally hoisted a La Niña Advisory, with sea-surface temperatures and winds in the tropical Pacific indicating the presence of (weak) La Niña conditions. This La Niña event is expected to remain weak, with roughly half of the models calling for persistence of La Niña conditions through the winter.
October 7, 2016 (Micro-Briefing)
-
September was much drier than normal for Colorado, southeastern Utah, and southeastern Wyoming. The rest of Utah and Wyoming was much wetter than normal. Statewide, Colorado was in the 30th percentile for precipitation, while Utah was in the 91st percentile, and Wyoming, the 89th percentile.
-
For Water Year 2016 that ended on September 30, all three states ended up slightly wetter than average, with Utah in the 69th percentile (105% of the 1981-2010 normal), Colorado in the 69th percentile (103% of normal) and Wyoming in the 55th percentile (103% of normal). Temperatures were unusually warm across the region, continuing the overall warming trend. Wyoming was in the 96th percentile for the water year, Colorado was in the 95th percentile, and Utah was in the 93rd percentile.
-
Since early August, drought conditions have eased in northeastern and north-central Wyoming, eastern Utah, and southwestern Colorado, while worsening and/or expanding in northwestern Wyoming, northwestern and central Utah, and north-central Colorado, with little overall net change for the region over the past two months.
-
Despite below-average inflows to Lake Powell for Water Year 2016, total Colorado River system storage as of September 30 was the same as one year ago, at 51% of capacity. Lake Powell was at 12.82 MAF, 53% of capacity. Lake Mead was at 9.63 MAF, 37% of capacity, and flirting with the 1075' level that is a trigger for declared Lower Basin shortage.
-
While sea-surface temperatures in the tropical Pacific have recently cooled to weak-La Niña territory, the official ENSO status remains ENSO-neutral. ENSO model forecasts have shifted away from the previous consensus towards a La Niña event, with more than half of the models now forecasting ENSO-neutral conditions through the winter.
August 4, 2016 (Micro-Briefing)
Highlights
-
July was another hotter-than-normal and drier-than-normal month for the region, though not quite as hot or dry as June. Most the region saw less than 70% of normal precipitation, while several areas had much-above-normal precipitation. Northern Utah and southern Wyoming were the driest parts of the region.
-
Drought conditions have expanded in Wyoming and Utah, with abnormally dry (D0) or worse conditions now covering more than 55% of both states. The 2-week and 4-week EDDI maps indicate that during July, the atmosphere was unusually thirsty over most of Wyoming and nearly all of Utah, pointing to greater potential for further drought onset and intensification.
-
Observed inflows to Lake Powell for April through July ended up at about 6630 KAF (93% of average and 102% of median), the third year in a row with inflows of 90-100% of average, following the the extreme drought years of 2012 and 2013.
-
According to ENSO model forecasts, a transition from the current ENSO-neutral to La Niña conditions during the coming fall and winter is still favored, but the likelihood has slipped since last month, to about 60%.
July 8, 2016 (Micro-Briefing)
Highlights
-
June was a very hot and very dry month for the region, with much of the region seeing less than 50% of normal precipitation, and above-normal precipitation only in scattered areas. It was the hottest June on record for Utah, the 2nd hottest for Wyoming, and the 3rd hottest for Colorado.
-
The dry June did not greatly impact the spring snowmelt and runoff, which was already well underway. As forecasted, below-average runoff has predominated at Utah forecast points, with near-average to above-average runoff in Colorado and Wyoming. April-July Lake Powell inflows are on track to exceed the official forecasts, at around 6750 KAF (95% of average).
-
The vast majority of reservoirs in Colorado and Wyoming have above-average storage for this time of year, with most major reservoirs near capacity or spilling. Utah's reservoirs are split between below- and above-average storage.
-
The 2015-2016 El Niño event has finally ended, and ENSO-neutral conditions are now present . ENSO forecasts indicate a roughly 75% chance of La Niña conditions during the coming fall and winter. Both the CPC outlook and the experimental SWcast outlook show little or no tilt for July–September precipitation for our region.
June 8, 2016 (Micro-Briefing)
Highlights
-
May's moisture was distributed unevenly across our region, but was above-normal overall, led by southwestern Wyoming, far northeastern Utah, and far northwestern Colorado recording >200% of normal precipitation.
-
While most SNOTEL sites have melted out, the higher-elevation sites indicate that the remaining late-season snowpack is above normal in Colorado and central and southern Wyoming, with below-normal conditions elsewhere. Warm temperatures and rapid snowmelt this week are leading to peak seasonal flows on many streams and rivers.
-
With the heavy May precipitation over the Green River Basin, the June 1 spring-summer runoff forecasts from CBRFC improved dramatically from the May 1 forecasts for forecast points within and below the basin. The CBRFC forecast for Lake Powell inflows improved from 5500 KAF (77% of average) to 6500 KAF (91% of average).
-
The El Niño event is rapidly weakening, with ENSO forecasts indicating a 75% chance of La Niña conditions during the coming fall and winter. The June–August CPC seasonal outlook shows a slight to moderate wet tilt for our region.
May 10, 2016
Highlights
-
April was wetter than normal for most of our region, with wide swaths of much-above-average precipitation in Wyoming, Utah, and Colorado.
-
With the melt season well underway, snowpack conditions are above normal in Colorado, southern Utah, and southern and central Wyoming, but below normal in northern and central Utah and northern Wyoming.
-
The May 1 spring-summer runoff forecasts improved from the April 1 forecasts in some basins, but worsened in northern and central Utah, and far western Wyoming. Most of the region's forecast points are expected to have near-average (90–109% of average) or below-average (70–89%) runoff.
-
The current El Niño event continues to decline, but is still expected to exert some influence on our region through spring, tilting the odds towards wetter-than-average conditions for most of the region.
Click on the thumbnail images in the text below to bring up the full-sized graphic
April Precipitation and Temperatures, and Current Drought
April saw overall wetter-than-normal conditions for our region, with greater than 150% of normal precipitation over broad swaths of Wyoming, Utah, and Colorado, and only relatively small areas seeing below-normal precipitation. On a statewide basis, April's precipitation was in the 82nd percentile for Wyoming, the 77th percentile for Utah, and the 89th percentile for Colorado.
Despite the above-normal precipitation, April’s temperatures were warmer than normal for most of the region. On a statewide basis, April temperatures were in the 81st percentile for Wyoming, the 80th percentile for Utah, and the 66th percentile for Colorado.
The latest US Drought Monitor, based on conditions as of May 3, shows that after above-average precipitation in April, drought conditions improved in southeastern Colorado, northern Utah, and several areas in Wyoming. A swath of central and southern Utah, however, degraded from drought-free to D0. The proportion of Utah in D2 or worse drought decreased from 13% to 0%; Colorado remained at 0%; and Wyoming remained at 2%.
Introducing EDDI
For the past three months, the Drought Monitoring portion of the Dashboard has featured a new product: EDDI, the Evaporative Demand Drought Index. EDDI is based on atmospheric data—wind speed, humidity, temperature, and sunshine—and it reflects the atmosphere’s “thirst” for water from the land surface. (EDDI does not explicitly incorporate precipitation, but many of the component variables are strongly related to precipitation anomalies.)
EDDI has been shown to capture fast-emerging (“flash”) drought earlier than other drought indices, while also providing useful information at longer time scales. Like SPI, it is calculated over a specific time period in the context of normal conditions over that time period. EDDI is expressed in discrete categories based on the current conditions' percentile ranking relative to past conditions. The EDDI drought categories (ED0-ED4) have the same percentile “bins” as as the corresponding US Drought Monitor categories (D0-D4). EDDI also has wetness categories (EW0-EW4), indicating wetter-than-normal surface conditions, occupying the 70th percentile and above, mirroring the drought categories.
As of May 4, the 2-week, 4-week, and 8-week EDDI maps show widespread wet (low-thirst) anomalies, consistent with more humid conditions associated with the above-normal precipitation. At the 12-week timescale, dry (high-thirst) conditions are seen in eastern Wyoming. The 6-month EDDI map shows wet conditions predominating for the region, while the 12-month EDDI map shows no dry patches except in far northern Wyoming, with large areas of wet (low-thirst) conditions Utah, Colorado, and western Wyoming
Snowpack
The Westwide Current Basin Snowpack map from NRCS as of May 9, while reflecting the usual volatility in basin snowpack statistics after the peak of the accumulation season, does indicate that above-normal snowpack persists in northern and central Colorado, southern and central Wyoming, and southern and northeastern Utah, while snowpacks are below normal in northern and central Utah, and northwestern Wyoming. With wet weather over most mountain areas in March and April, the SWE time-series for many sites showed a bumpy "plateau" rather than a distinct peak. Since May 1st, nearly all sites have seen rapid melt.
According to the Colorado Dust-on-Snow program, this season has seen low to moderate dust loading, with six dust events through early May recorded at the Senator Beck Basin and elsewhere in western Colorado.
Current Streamflows
As of May 9, the maps of current streamflows for Colorado, Utah, and Wyoming show that flows are generally normal or above normal in Colorado, and above normal to much above normal in Wyoming. In Utah, the flows are more distributed across the below-normal, normal, and above-normal classes, with normal flows predominating. For the most part, flows on larger streams and rivers across the region are still rising towards their seasonal peak flows. On May 9, the Colorado River near the CO-UT State Line was in the 61st percentile, 120% of median flow; the Green River at Jensen, UT was in the 71th percentile, 141% of median flow; and the San Juan River near Bluff, UT, was in the 27th percentile, 58% of median flow.
Spring-Summer Streamflow Forecasts
The May 1 spring-summer streamflow forecasts, released by NOAA CBRFC and the NRCS in early May, are improved over the April 1 forecasts for much of Wyoming, northern and central Colorado, and southern Utah, but have slipped in northern Utah and far western Wyoming. The NRCS Westwide Streamflow Forecast Map shows that in Colorado, nearly all forecast points are still expected to have near-average (90–109%) or below-average (70–89%) spring and summer runoff, with several now in the above-average (110–129%) category.
In southern Utah, most forecast points are expected to have near-average (90–109%) or below-average (70–89%) runoff, while in central and northern Utah, most forecast points are expected to have mostly below-average (70–89%) or much-below average (50–69%) runoff.
In Wyoming, near-average (90–109%) or above-average (110–129%) is expected at nearly all forecast points east of the Continental Divide, but mostly below-average (70–89%) runoff is expected west of the Divide.
IMPORTANT NOTE: While NRCS and NOAA continue to collaborate on streamflow forecasts, the forecast values are no longer being strictly coordinated between NRCS and some of the RFCs, including CBRFC. That said, the NRCS May 1 forecast for Lake Powell April–July inflows is 5500 KAF, 77% of average, up from 75% of average last month. The NOAA CBRFC May 1 forecast for the same point is also 5500 KAF, 77% of average, up from 74% of average one month ago.
Seasonal Climate and Drought Forecasts, including ENSO
The monthly Climate Outlook for May released on April 30 by NOAA CPC shows a strong wet tilt for most of Utah, a moderate wet tilt for the rest of Utah and for Colorado and southern Wyoming, and a slight wet tilt for the rest of Wyoming. The seasonal outlook for May–July released April 21 shows a similar pattern, though the wet tilt is weaker. The outlook for June–August shows a smaller area of wet tilt centered over our region, with a moderate wet tilt for northern Utah, northern Colorado, and southern Wyoming.
The skill-masked experimental PSD precipitation outlook (“SWcast”) issued April 14 for the April–June period shows a moderate-to-strong wet tilt (>+10%) for central and eastern Colorado, and a slight dry tilt for east-central Utah and northwestern Colorado.
The latest CPC Seasonal Drought Outlook released on April 21 projects that most areas of drought (D1 or worse) in Utah will improve or be removed by the end of July, but some drought is expected to persist. The drought conditions in north-central Wyoming are also expected to improve or be removed.
Sea-surface temperatures in the tropical Pacific and other ENSO indicators show that the current El Niño event is continuing to decline. In the past month, the benchmark Niño 3.4 index has dropped sharply, to +0.8°C for the latest weekly value, not far above the +0.5°C threshold for El Niño conditions. The Multivariate ENSO Index (MEI), however, increased slightly to +2.1 for the March–April period, the 4th-highest value for this time of year since 1950.
The IRI/CPC probabilistic ENSO forecast based on the mid-April ENSO Prediction Plume calls for the El Niño event to weaken rapidly to neutral conditions through spring 2016, with a 30% likelihood of transitioning to weak La Niña conditions by summer, increasing to 60% by fall.
April 13, 2016
Highlights
-
March was wetter than normal for the northern half of our region, including Wyoming, northern Utah, and northern Colorado, with drier conditions to the south.
-
Snowpack conditions held steady or improved in the northern basins in the past month, but declined in most southern basins, with rapid melt since April 1. Most of region's basins have 80–110% of median SWE for early April, with an increasing number now below 80%.
-
The April 1 spring-summer runoff forecasts improved from the March 1 forecasts in the northern basins with high recent precipitation, but worsened in southern Colorado and southern Utah. Most of the region's forecast points are expected to have near-average (90–109% of average) or below-average (70–89%) runoff.
-
The current El Niño event continues to wind down and is barely hanging onto “strong” status. The likely persistence of El Niño conditions through the spring and early summer is reflected in a wet tilt for most of the region in the seasonal precipitation forecasts.
Click on the thumbnail images in the text below to bring up the full-sized graphic
March Precipitation and Temperatures, and Current Drought
The pattern of March precipitation in our region reflected an active northerly storm track that split the region into “haves” and “have-nots," with wetter-than-normal conditions across Wyoming and in northern Utah and northern Colorado, while the southern half of the region ended up much drier than normal, especially southern and central Utah, and southeastern and southwestern Colorado. On a statewide basis, February's precipitation was in the 90th percentile for Wyoming, the 48th percentile for Utah, and the 40th percentile for Colorado.
Despite the above-normal precipitation for the northern half of the region, March’s temperatures were warmer than normal in those areas, and elsewhere in the region. On a statewide basis, February's temperatures were in the 91st percentile for Wyoming, the 91st percentile for Utah, and the 84th percentile for Colorado.
The latest US Drought Monitor, based on conditions as of April 5, shows that after above-average precipitation in March, several large areas in Wyoming improved by one category in the past month, as did smaller areas in northwestern and northeastern Colorado. Conversely, the dry March in southern Colorado led to degradation by one category, to D0 or D1, over a broad area. The proportion of of the region in D2 or worse drought did not change over the past month and remains at: Colorado, 0%; Utah, 13%; Wyoming, 2%.
Introducing EDDI
For the past three months, the Drought Monitoring portion of the Dashboard has featured a new product: EDDI, the Evaporative Demand Drought Index. EDDI is based on atmospheric data--wind speed, humidity, temperature, and sunshine--and it reflects the atmosphere’s “thirst” for water from the land surface. (EDDI does not explicitly incorporate precipitation, but many of the component variables are strongly related to precipitation anomalies.)
EDDI has been shown to capture fast-emerging (“flash”) drought earlier than other drought indices, while also providing useful information at longer time scales. Like SPI, it is calculated over a specific time period in the context of normal conditions over that time period. EDDI is expressed in discrete categories based on the current conditions' percentile ranking relative to past conditions. The EDDI drought categories (ED0-ED4) have the same percentile “bins” as as the corresponding US Drought Monitor categories (D0-D4). EDDI also has wetness categories (EW0-EW4), indicating wetter-than-normal surface conditions, occupying the 70th percentile and above, mirroring the drought categories.
As of April 8, the 2-week and 4-week EDDI maps show that conditions have shifted to wet (low-thirst) since early March for much of the region, especially since the 3rd week of March. At the 8-week and 12-week timescales, dry conditions are more prevalent in the regional picture, especially in eastern Wyoming and eastern Colorado. The 6-month EDDI map shows moderate dryness over eastern Wyoming and eastern Colorado, while the 12-month EDDI map shows no dry patches except in far northeastern Wyoming, with large areas of low-thirst conditions in eastern Utah and western Colorado.
Snowpack
The Current Basin Snowpack map from NRCS as of April 13 shows that since early March, SWE conditions have held steady for most of Wyoming, northern Utah, and northern Colorado, but have worsened for central and southern Utah, southern Colorado, and northeastern Wyoming. As in February, the northern basins picked up more snow than the southern basins in March and early April. Currently, basins north of I-70 in Colorado have near-normal SWE, while those to the south are below normal. In Utah, the southern basins have near-normal to well-below-normal SWE, while central and northern basins are mostly below normal. In Wyoming, the southern and western basins are mainly near normal or above normal, while the central and northeastern basins are below normal or well below normal.
In the southern parts of the region where there has been below-average snowfall, there has been early and rapid melt of the snowpack, especially on southern aspects and at lower elevations (below 9000’). Cascade SNOTEL site (8880’) north of Durango has nearly melted out, about 3 weeks ahead of the median melt-out date, after reaching a near-normal peak in early February.
According to the Colorado Dust-on-Snow program, this season has seen low to moderate dust loading thus far, with four dust events through early April recorded at the Senator Beck Basin and elsewhere in western Colorado.
Spring-Summer Streamflow Forecasts
The April 1 spring-summer streamflow forecasts, released by NOAA CBRFC and the NRCS in early April, are improved over the March 1 forecasts in much of Wyoming, and parts of northern Utah and northern Colorado, but have slipped elsewhere, especially in southwestern Colorado. The NRCS Westwide Streamflow Forecast Map shows that in Colorado, nearly all forecast points are still expected to have near-average (90–109%) or below-average (70–89%) spring and summer runoff, but more points are now in the below-average category.
In southern Utah, most forecast points are expected to have near-average or below-average runoff, while further north, the Wasatch Range-fed forecast points are expected to have mostly below-average runoff, or near-average runoff, and the Uinta Range-fed forecast points, below-average or much-below average (50–69%) runoff.
In Wyoming, the picture is much improved over month ago, with near-average runoff expected at the majority of across the state, with a few points in central Wyoming now expecting above-average runoff, and the other points split between below-average and much-below-average runoff. The north-central and northeastern basins are expected to have the worst outcomes.
IMPORTANT NOTE: While NRCS and NOAA continue to collaborate on streamflow forecasts, the forecast values are no longer being strictly coordinated between NRCS and some of the RFCs, including CBRFC. For example, the NRCS April 1 forecast for Lake Powell April–July inflows is 5400 KAF, 75% of average, down from 77% of average last month. The NOAA CBRFC April 1 forecast for the same point is 5300 KAF, 74% of average, down from 80% of average one month ago.
Seasonal Climate and Drought Forecasts, including ENSO
The monthly Climate Outlook for April released on March 31 by NOAA CPC shows a moderate wet tilt for most of Colorado, and a slight wet tilt for the rest of Colorado, all of Utah, and far southern Wyoming. The seasonal outlook for April–June released March 17 shows a very similar pattern, with the area of wet tilt expanded northwards, so all of Wyoming has a slight wet tilt. The outlook for May–July shows the area of wet tilt having retreated back towards the south. The overall forecasted pattern for the western US, including the wet tilt for our region, reflects the expected influence of El Niño conditions through spring.
The skill-masked experimental PSD precipitation outlook (“SWcast”) issued March 14 for the April–June period shows a moderate-to-strong wet tilt (>+10%) for central and eastern Colorado, which is very similar to the wet tilt shown in the CPC seasonal outlook for that period.
The latest CPC Seasonal Drought Outlook released on March 17 projects that areas of drought (D1 or worse) in Utah will improve or be removed by the end of June. The drought conditions in north-central Wyoming are also expected to improve or be removed. Again, these changes are expected mainly due to the forecasted impacts of the El Niño event.
Sea-surface temperatures in the tropical Pacific and other ENSO indicators tell us that the current El Niño event, while fading, remains in the "strong" category. In the past month, the benchmark Niño 3.4 index has trended downward, to +2.0°C for the latest weekly value. The Multivariate ENSO Index (MEI) fell slightly to +2.0 for the February–March period, still the 3rd-highest value for this time of year since 1950.
The IRI/CPC probabilistic ENSO forecast based on the mid-March ENSO Prediction Plume calls for the El Niño event to weaken rapidly through spring 2016, with a 60% likelihood of returning to neutral ENSO conditions in the summer, and a 45% chance of transitioning to La Niña conditions by fall, compared to the baseline climatological likelihood of La Niña conditions of 30%.
March 10, 2016
Highlights
-
February was overall dry and very warm for our region, with one major storm very early in the month providing most of the moisture.
-
Snowpack conditions worsened in most basins in the past month, and the vast majority of the region's basins now have 80–100% of median SWE for early March.
-
The March 1 spring-summer runoff forecasts are sharply reduced from the February 1 forecasts, with the region's forecast points roughly split between near-average (90–109% of average), below-average (70–89%), and well-below-average (50–69%) runoff.
-
The current El Niño event is on the wane but remains strong. The persistence of El Niño conditions through the spring is reflected in a wet tilt for most of the region in the seasonal precipitation forecasts.
Click on the thumbnail images in the text below to bring up the full-sized graphic
February Precipitation and Temperatures, and Current Drought
February's precipitation was mostly below-average for the region, with one significant storm system in the first few days of February, followed by unusually dry conditions for the remainder of the month. That one storm, however, was enough so that the month ended up wetter-than-normal in eastern Colorado, southeastern and northeastern Wyoming, and parts of southern Utah. Conversely, northern and central Utah, northwestern Wyoming, and southwestern Colorado ended up much drier than normal. On a statewide basis, February's precipitation was in the 18th percentile for Utah, and the 25th percentile for Wyoming, and the 30th percentile for Colorado.
With high pressure and dry and warm conditions prevailing for most of the month, February’s temperatures were well above normal for nearly all of the region, especially in Wyoming. On a statewide basis, February's temperatures were in the 98th percentile for Wyoming, the 93rd percentile for Colorado, and the 87th percentile for Utah.
The latest US Drought Monitor, based on conditions as of March 8, shows that after the mostly below-average precipitation in February, several areas in northern Wyoming, south-central Utah, and southeastern Colorado degraded by one category in the past month, with D2 emerging in the Bighorn Mountains in north-central Wyoming. Conversely, one area in northeastern Wyoming and two in eastern Colorado improved by one category. The proportion of Colorado and D2 or worse drought remains at zero; in Utah, it remains at 13%; in Wyoming, it increased from zero to 2%.
Introducing EDDI
For the past two months, the Drought Monitoring portion of the Dashboard has featured a new product: EDDI, the Evaporative Demand Drought Index. EDDI is based on atmospheric data--wind speed, humidity, temperature, and sunshine--and it reflects the atmosphere’s “thirst” for water from the land surface. (EDDI does not explicitly incorporate precipitation, but many of the component variables are strongly related to precipitation anomalies.)
EDDI has been shown to capture fast-emerging (“flash”) drought earlier than other drought indices, while also providing useful information at longer time scales. Like SPI, it is calculated over a specific time period in the context of normal conditions over that time period. EDDI is expressed in discrete categories based on the current conditions' percentile ranking relative to past conditions. The EDDI drought categories (ED0-ED4) have the same percentile “bins” as as the corresponding US Drought Monitor categories (D0-D4). EDDI also has wetness categories (EW0-EW4), indicating wetter-than-normal surface conditions, occupying the 70th percentile and above, mirroring the drought categories.
As of March 2, the 2-week and 4-week EDDI maps show that drought (high-thirst) conditions have emerged since early February in most of Colorado and Wyoming, especially in northeastern Colorado and eastern and northern Wyoming. At the 8-week and 12-week timescales, dry conditions are more restricted to Colorado, while Utah is mainly wet. The 6-month EDDI map shows moderate dryness over most of Wyoming and central and eastern Colorado, while in the 12-month EDDI map those dry patches are much more limited.
Snowpack
The Current Basin Snowpack map from NRCS as of March 10 shows that SWE conditions worsened for much of the region compared to early February, with the strong southwest–northeast gradient typical of El Niño winters weakening as the northern basins picked up more snow than the southern basins in the past month. Basins across Colorado have near-normal SWE, with all being between 88–98% of median. In Utah, the southern basins are near-normal while central and northern basins are mostly below average with 75–90% of median. In Wyoming, the southern and western basins are mainly near-normal, while the central and northeastern basins are lower, with 55–80% of median SWE.
Spring-Summer Streamflow Forecasts
The March 1 spring-summer streamflow forecasts, released by NOAA CBRFC and the NRCS in early March, show widespread and significant reductions in the expected runoff for Utah and Colorado compared to the February 1 forecasts. The NRCS Westwide Streamflow Forecast Map shows that in Colorado, nearly all forecast points are now expected to have near-average (90–109%) or below-average (70–89%) spring and summer runoff. In southern Utah, most forecast points are expected to have near-average or below-average runoff, while further north, the Wasatch Range-fed forecast points are expected to have mostly below-average runoff, or near-average runoff, and the Uinta Range-fed forecast points, below-average or much-below average (50–69%) runoff. In Wyoming, the picture is similar to a month ago, with near-average runoff expected at only a handful of points in the northwestern and southeastern basins, with most points across the state expected to have have below-average to much-below-average spring and summer runoff. Note that the March 1 streamflow forecasts do not reflect the increased chances for above-normal precipitation for most of the region this spring (March–May), as described below.
IMPORTANT NOTE: While NRCS and NOAA continue to collaborate on streamflow forecasts, the forecast values are no longer being strictly coordinated between NRCS and some of the RFCs, including CBRFC. For example, the NRCS March 1 forecast for Lake Powell April–July inflows is 5500 KAF, 77% of average, down from 98% of average last month. The NOAA CBRFC March 1 forecast for the same point is 5700 KAF, 80% of average, down from 94% of average one month ago.
Seasonal Climate and Drought Forecasts, including ENSO
The monthly Climate Outlook for March released on February 29 by NOAA CPC shows a slight to strong wet tilt for precipitation for all of Colorado and most of Utah, strongest in southeastern Colorado, and a slight wet tilt for southeastern Wyoming. The seasonal outlook for March–May released February 18 shows a very similar pattern, with the area of wet tilt expanded northwards, so that nearly of the region has wet tilt, including a strong wet tilt for most of Colorado (“Strong” = the probability for a season in the wettest third is 50% or greater, compared to the baseline probability of 33%.) The outlook for April–June shows the wet tilt being much reduced in strength, though not coverage. The overall forecasted pattern for the western US, including the wet tilt for our region, reflects the expected influence of strong El Niño conditions through spring.
The skill-masked experimental PSD precipitation outlook (“SWcast”) issued January 19 for the January–March period shows a moderate wet tilt (>+10%) for western and northern Utah and north-central Colorado, and a slight wet tilt for most of the rest of Utah and Colorado. The unusually extensive area of wet tilt has persisted through three iterations of the January–March SWcast, and follows on a high skill score (i.e., validation) for the October–December 2015 SWcast.
The latest CPC Seasonal Drought Outlook released on February 18 projects that areas of drought (D1 or worse) in Utah will improve or be removed by the end of May. The drought conditions in north-central Wyoming are also expected to improve. Again, these changes are expected mainly due to the forecasted impacts of the El Niño event.
Sea-surface temperatures in the tropical Pacific and other ENSO indicators tell us that the current El Niño event, while on the wane, remains in the "strong" category. In the past month, the benchmark Niño 3.4 index has trended downward, to +2.0°C for the latest weekly value. The Multivariate ENSO Index (MEI) fell slightly +2.1 for the January–February period, still the 3rd-highest value for this time of year since 1950.
The IRI/CPC probabilistic ENSO forecast based on the mid-February ENSO Prediction Plume calls for the El Niño event to weaken rapidly through spring (March–May) 2016, with a >50% likelihood of returning to neutral ENSO conditions in the summer, and then in fall, a decent chance of rapidly transitioning to La Niña conditions.
February 12, 2016
Highlights
-
January saw wetter-than-average conditions for most of Utah, with Colorado split between wet and dry, and Wyoming more on the dry side. February had a very wet start for most of the region.
-
Snowpack conditions have improved in most basins, and are near or above normal in all of Utah and Colorado, and southern and far western Wyoming. Conditions in the rest of Wyoming are lagging well behind normal.
-
The current El Niño event has peaked but remains very strong. El Niño conditions are nearly certain to continue through the spring, which is reflected in a wet tilt for Colorado and Utah in the seasonal forecasts.
Click on the thumbnail images in the text below to bring up the full-sized graphic
January Precipitation and Temperatures, and Current Drought
January's precipitation was another mixed bag for the region. Wetter-than-normal conditions prevailed in most of Utah, western Colorado, and southern Wyoming. Northeastern Utah, most of eastern Colorado, and northern Wyoming were drier than normal. On a statewide basis, January's precipitation was in the 73rd percentile for Utah, the 59th percentile for Colorado, and the 36th percentile for Wyoming. So far (through the 11th), February has been very wet for most of the region, though that mainly reflects the impact of the large and intense storm from the 31st to the 3rd, with warm and dry conditions prevailing since then.
January’s temperatures were generally above normal in eastern Colorado and most of Wyoming, with cooler than normal conditions for much of Utah, and western Colorado. On a statewide basis, January's temperatures were in the 58th percentile for Utah, the 82nd percentile for Wyoming, and the 68th percentile for Colorado.
The latest US Drought Monitor, based on conditions as of February 9, shows that after above-normal precipitation in January and early February, several areas in central and western Utah improved by one or two categories in the past month. Conversely, after extended dry weather, three additional areas in northern Wyoming have degraded to D0. The proportion of Colorado and Wyoming in D2 or worse drought remains at zero; in Utah, it has declined to 13%.
Introducing EDDI
For the past month, the Drought Monitoring portion of the Dashboard has featured a new product: EDDI, the Evaporative Demand Drought Index. EDDI is based on atmospheric data--wind speed, humidity, temperature, and sunshine--and it reflects the atmosphere’s “thirst” for water from the land surface. (EDDI does not explicitly incorporate precipitation, but many of the component variables are strongly related to precipitation anomalies.)
EDDI has been shown to capture fast-emerging (“flash”) drought earlier than other drought indices, while also providing useful information at longer time scales. Like SPI, it is calculated over a specific time period in the context of normal conditions over that time period. EDDI is expressed in discrete categories based on the current conditions' percentile ranking relative to past conditions. The EDDI drought categories (ED0-ED4) have the same percentile “bins” as as the corresponding US Drought Monitor categories (D0-D4). EDDI also has wetness categories (EW0-EW4), indicating wetter-than-normal surface conditions, occupying the 70th percentile and above, mirroring the drought categories.
As of February 5, the 2-week through 12-week EDDI maps show wet or "low-thirst" conditions predominating over drought (high-thirst) conditions in our region, especially in Utah and southern and western Colorado, though there is a persistent patch of drought conditions in eastern Colorado. At longer timescales, there is more drought shown in eastern and central Colorado in the most recent 6-month EDDI map, while these are not as evident in the 12-month EDDI map.
Snowpack
The Current Basin Snowpack map from NRCS as of February 10 shows modest overall improvement in SWE conditions across the region compared to early January, though the strong southwest-northeast gradient typical of El Niño winters persists. Basins in Colorado, Utah, and in southern and western Wyoming all have near-median or above-median SWE, with the basins in southern Utah having the highest SWE (>120%) relative to median. Basins in northern and central Wyoming still have below-median SWE, with most reporting 55–85% of median SWE.
Spring-Summer Streamflow Forecasts
The February 1 spring-summer streamflow forecasts, released by NOAA CBRFC and the NRCS in early February, show only small changes in the expected runoff compared to the January 1 forecasts. The NRCS Westwide Streamflow Forecast Map shows that in Colorado, nearly all forecast points are expected to have near-average (90–109%) or above-average (110-129%) spring and summer runoff. In southern Utah, most forecast points are expected to have above-average or much-above-average (130-149%) runoff, while furthern north, the Wasatch Range-fed forecast points are expected to have near-average runoff, and the Uinta Range-fed forecast points, below-average (70–89%) runoff. In Wyoming, the picture is drier than the other two states, with near-average runoff expected at only a handful of points, with most expected to have have below-average to much-below-average (50–69%) spring and summer runoff.
IMPORTANT NOTE: While NRCS and NOAA continue to collaborate on streamflow forecasts, the forecast values are no longer being strictly coordinated between NRCS and some of the RFCs, including the CBRFC. For example, the NRCS February 1 forecast for Lake Powell April–July inflows is 7000 KAF, 98% of average. The NOAA CBRFC February 1 forecast for the same point is 6700 KAF, 94% of average. In general, the CBRFC February 1 forecasts are more pessimistic than the NRCS February 1 forecasts for most points in Utah, and for many points in western Colorado as well.
Seasonal Climate and Drought Forecasts, including ENSO
The monthly Climate Outlook for February released on January 31 by NOAA CPC shows a slight to moderate wet tilt for precipitation for all of Colorado and most of Utah, and a slight to moderate dry tilt for western and northern Wyoming. The seasonal outlook for February–April released January 21 shows the area of wet tilt expanded northwards, with most of the region seeing a wet tilt, including a strong wet tilt for southern Colorado. The outlook for March–May shows a similar pattern , with the area of wet tilt expanded further, into Wyoming. The overall forecasted pattern for the western US, including the wet and dry tilts for different parts of our region, reflects the expected strong El Niño conditions through winter into early spring.
The skill-masked experimental PSD precipitation outlook (“SWcast”) issued January 21 for the January–March period shows a moderate wet tilt (>+10%) for western and northern Utah and north-central Colorado, and a slight wet tilt for most of the rest of Utah and Colorado. The unusually extensive area of wet tilt has persisted through three iterations of the January–March SWcast, and follows on a high skill score (i.e., validation) for the October–December 2015 SWcast.
The latest CPC Seasonal Drought Outlook released on January 21 projects that areas of drought (D1 or worse) in Utah will improve or be removed by the end of March. Persistence of the drought in north-central Wyoming is expected. Again, these changes are expected mainly due to the forecasted impacts of the El Niño event.
Sea-surface temperatures in the tropical Pacific peaked in November, but have only modestly declined in the Niño 3, 4, and 3.4 regions. The latest weekly value of the benchmark Niño 3.4 index is +2.6°C, well above the threshold for strong El Niño conditions. The Multivariate ENSO Index (MEI) has held relatively steady in the past four months, recording +2.2 for the December–January period, the 3rd-highest value for this time of year since 1950.
The IRI/CPC probabilistic ENSO forecast based on the mid-January ENSO Prediction Plume calls for a ~98% chance for the El Niño to persist into spring (March–May) 2016, though weakening through the spring, with a ~50% chance of returning to neutral ENSO conditions in the summer, and a ~30% chance of rapidly transitioning to La Nina conditions in summer.
January 14, 2016 (Micro-Briefing)
Highlights
-
December's precipitation was a mixed bag for the region. Western and northeastern Colorado, south-central Utah, and southwestern Wyoming were much wetter than normal, while western Utah, southeastern Colorado, and north-central Wyoming were much drier than normal. So far in January, the storms have favored southern Utah, southwestern Colorado, and central Wyoming.
-
Since early December, snowpacks have held steady or improved, relative to normal, over nearly the entire region. Currently, the snowpack is near normal (>90% of median) or above normal in all of Utah except the Wasatch Front, in all of Colorado except the northwestern basins, and in far southeastern and southwestern Wyoming. Conditions in northern Utah and most of Wyoming are below-normal, especially in north-central and northeastern Wyoming.
-
The first official seasonal runoff forecasts, as of January 1, were issued in early January by NRCS and NOAA. They call for near-average (90-109%) or above-average (>100%) spring-summer runoff in all of Colorado's basins except the Yampa; in southern and central Utah, and in southeastern and northwestern Wyoming. Runoff elsewhere in the region is forecasted to be below average (70-89%; northern Utah and southwestern Wyoming) or well below average (50-69%; central and north-central Wyoming).
-
El Niño conditions have very likely peaked and are declining in strength, but remain very strong. NOAA CPC precipitation outlooks for late winter and spring show a wet tilt for the southern portions of our region, due to El Niño’s expected continued influence.
December 17, 2015
Highlights
-
November saw wetter-than-average conditions over the majority of the region, especially in Colorado, though some key mountain areas were on the dry side.
-
Snowpack conditions continue to lag behind normal in northern and central Utah, northwestern Colorado, and most of Wyoming. Snowpack conditions in the rest of Colorado, southern and eastern Utah, and southeastern Wyoming are near normal to well above normal.
-
The current El Niño event has likely peaked but remains very strong. El Niño conditions are very likely to continue through the spring, with varying influences on weather across the region.
Click on the thumbnail images in the text below to bring up the full-sized graphic
November Precipitation and Temperatures, and Current Drought
In November, precipitation was overall above-normal for the region. Colorado was the wettest state in the region, with large areas of above-normal precipitation in the western, northeastern, and southeastern parts of the state. Wyoming and Utah didn’t fare quite as as well, but both had above-normal precipitation over the majority of the state. However, several key mountain areas, including the Wasatch and the Wind River ranges, were drier than normal. On a statewide basis, November's precipitation was in the 86th percentile for Colorado, the 64th percentile for Utah, and the 60th percentile for Wyoming. The first half of December has been generally wet as well, with the storms particularly favoring northern Colorado, southeastern Wyoming, and western Utah, and few areas seeing less than 75% of normal precipitation for the period.
After the unusual warmth of September and October, November’s temperatures were closer to normal across the region, with Utah joining the states to its west in experiencing a relatively cool month, while Colorado and Wyoming were at the edge of the unusually warm conditions in the central and eastern U.S., and ended up slightly above the monthly normals. On a statewide basis, November's temperatures were in the 32nd percentile for Utah, the 53rd percentile for Wyoming, and the 59th percentile for Colorado.
The latest US Drought Monitor, based on conditions as of December 15, shows that after above-normal precipitation in November and early December, several small areas in central Utah; northwestern, central, and eastern Colorado; and southern Wyoming have improved by one category in the past month. Conversely, an area in north-central Wyoming has degraded to D0. The proportion of Colorado and Wyoming in D2 or worse drought remains at zero; in Utah, it declined to 23%.
Snowpack
The Current Basin Snowpack map from NRCSas of December 17 shows sharp differences in percent-of-median SWE conditions across the region. Basins in most of Colorado, in southern and eastern Utah, and in far southeastern and far northwestern Wyoming have benefited the most from early-season storms, and have near-median or above-median SWE. Basins in northwestern Colorado, northern and central Utah and most of Wyoming have below-median SWE, with most basins in these areas reporting 55–85% of median SWE. (Note that NRCS is experiencing problems with data reporting at many SNOTEL sites in our region, and several basins are "blanked out" on the map due to an insufficient number of sites reporting from those basins. Go to the NRCS Interactive SNOTEL Map to see the sites reporting from those basins.)
Seasonal Climate and Drought Forecasts, including ENSO
The monthly Climate Outlook for December released on November 30 by NOAA CPC shows a slight to moderate wet tilt for precipitation for most of Colorado and the far southeastern corner of Utah, and a slight to moderate dry tilt for western and northern Wyoming. The seasonal outlook released December 15 for January–March shows a very similar pattern: slight or moderate wet tilt over most of Colorado and southern Utah, and a slight to moderate dry tilt for most of Wyoming. The outlook for February–April shows the area of wet tilt extending north into Wyoming, while the dry-tilt area retreats to the north. The overall forecasted pattern for the western US, including the wet and dry tilts for different parts of our region, reflects the expected strong El Niño conditions through winter into early spring.
The skill-masked experimental PSD precipitation outlook (“SWcast”) issued November 16 for the January–March period has a moderate wet tilt (>+10%) for northern Utah and central Colorado. The non-masked version shows this wet tilt covering all of Utah and most of Colorado, very similar to the previous forecast for January–March, but the skill of forecasts at this time of year is lower so more of the region is masked out.
The latest CPC Seasonal Drought Outlook released on December 17 projects that areas of drought (D1 or worse) in Utah will improve or be removed by the end of March. Additional drought development is expected in far northern Wyoming. Again, these changes are expected mainly due to the forecasted impacts of the El Niño event.
Sea-surface temperatures appear to have peaked in tropical Pacific in the past few weeks, after rising slightly from early November values. The latest weekly value of the benchmark Niño 3.4 index is +2.8°C, well above the threshold for strong El Niño conditions. The Multivariate ENSO Index (MEI) recovered slightly in the September–October period to +2.3, the 3rd-highest value for this time of year since 1950, indicating very strong El Niño conditions.
The IRI/CPC probabilistic ENSO forecast based on the mid-November ENSO Prediction Plume calls for a >90% chance for the El Niño to persist into spring (March–May) 2016, while weakening through the spring, with a ~50% chance of returning to neutral ENSO conditions by summer.
November 12, 2015
Highlights
-
October saw wetter-than-average conditions over most of Utah and Colorado, while dry conditions prevailed for most of Wyoming. Temperatures were extremely warm for the month across all three states.
-
The seasonal snowpack is off to a slow start in mountain areas in northern Utah and most of Wyoming. Snowpack conditions in Colorado, southern and eastern Utah, and southeastern Wyoming are near normal to well above normal.
-
El Niño conditions have strengthened further by some indicators, but this event is likely near its peak. The El Niño event is very likely to continue through the spring, with varying influences on weather across the region.
October Precipitation and Temperatures, and Current Drought
Across the region, October saw mainly above-normal precipitation, but there were distinct winners and losers. Surges of subtropical moisture from the southwest led to well-above-average precipitation in southern and northwestern Utah, southern and eastern Colorado, and southeastern Wyoming. Conversely, much of Wyoming, northwestern Colorado, and the rest of northern Utah received below-average precipitation for the month. Unlike in September, however, there were few areas with less than 50% of average precipitation. On a statewide basis, October's precipitation was in the 74th percentile for Colorado, the 80th percentile for Utah, and the 38th percentile for Wyoming.
Like September, October was far warmer than normal, with temperatures of 4–10°F above the monthly normal. The warmth was particularly unusual given the above-average precipitation in most areas, reflecting the subtropical moisture sources for that precipitation, as well as an absence of Arctic cold air outbreaks during the month. Salt Lake City had its warmest-ever October, 7.5°F above normal. On a statewide basis, this was the 2nd-warmest October for Wyoming (99th percentile), the 3rd-warmest in Colorado (98th percentile), and the 4th warmest in Utah (97th percentile) since the start of the records in 1895.
The latest US Drought Monitor, based on conditions as of November 10, shows that after the varying precipitation outcomes in October, several areas in southern Utah, eastern Colorado, and northeastern Wyoming have improved in the past month to drought-free or abnormally dry (D0), while areas in central and northwestern Colorado and several parts of Wyoming have degraded to D0. The proportion of Colorado and Wyoming in D2 or worse drought remains at zero; in Utah, it has declined slightly to 26%.
Snowpack
The Current Basin Snowpack map from NRCSas of November 11 shows wildly varying percent-of-median SWE conditions across the region’s basins, reflecting the winners and losers in October and early November precipitation, as well as the usual volatility of early-season snowpack statistics. Basins across Colorado, in southern and eastern Utah, and in southeastern Wyoming have fared the best, with near-median to well-above-median SWE. Basins in the rest of Wyoming and northern Utah have below-median SWE, with most basins in northern and central Wyoming reporting less than 50% of median SWE.
Seasonal Climate and Drought Forecasts, including ENSO
The monthly Climate Outlook for Novemberreleased on October 31 by NOAA CPC shows a moderate wet tilt for precipitation for all of Colorado and most of Utah and Wyoming, and a slight wet tilt for the rest of Utah and Wyoming. The seasonal outlooks released October 15 show a slight or moderate wet tilt for the November–January and December–February periods over southern Utah and southern Colorado. These outlooks also show a dry tilt over northwestern Wyoming that expands and strenghtens in the December–February period. The overall forecasted pattern for the western US, including the wet and dry tilts for parts of our region, reflects the expected strong El Niño conditions through winter.
As reported in the previous briefing: The experimental PSD precipitation outlook (“SWcast”) issued September 21 also shows a wet tilt for the October–December period, but mainly for southern Utah, and also for far western Colorado and extreme northeastern Colorado. The long-lead SWcast issued October 9 for the January–March period is about as "green" as they come, with a wet tilt across all of Utah and Colorado, with the weakest tilt in western Colorado and the strongest (>+10%) in western Utah. As with the CPC forecasts, the wet tilt is mainly from the El Niño.
The latest CPC Seasonal Drought Outlook released on October 15 projects that areas of drought (D1 or worse) in southern Utah will improve or be removed by the end of January. However, in northern Utah, drought is projected to persist or intensify, with additional drought development expected in northern Wyoming. Again, these changes are expected mainly due to the forecasted impacts of the El Niño event.
Sea-surface temperatures have continued to warm in the eastern tropical Pacific since early October, while declining slightly in the central tropical Pacific. The latest weekly value of the benchmark Niño 3.4 index is +2.8°C, well above the threshold for strong El Niño conditions, tying the highest weekly value during the 1997-98 El Niño event. On a monthly basis, however, the October 2015 Niño 3.4 index lags the peak values during the 1982-83 and 1997-98 El Niño events. The Multivariate ENSO Index (MEI) declined in the September–October period to +2.2, though this is still the 2nd-highest value for this time of year since 1950, and indicates very strong El Niño conditions.
The IRI/CPC probabilistic ENSO forecast based on the mid-October ENSO Prediction Plume calls for a 100% chance that El Niño conditions will continue through the winter, a 90% chance for the El Niño to persist into spring (March–May) 2016, and then a >50% chance of returning to neutral ENSO conditions by late summer.
October 13, 2015
Highlights
-
September was dry overall for our region, with many areas receiving less than 25% of average precipitation for the month. Temperatures were extremely warm, with both Colorado and Utah recording their record-warmest September.
-
Water-year 2015 ended up with near-average (Utah) and above-average (Colorado and Wyoming) statewide precipitation for the 12-month period. The water-year average temperatures were unusually warm in all three states.
-
Nearly all reservoirs in Colorado and Wyoming had above-average storage as of the end of September; Utah's reservoirs had mostly below-average storage.
-
El Niño conditions have strengthened further and are virtually certain to continue through the winter. El Niño’s expected influence is seen in seasonal precipitation outlooks showing a wet tilt for most or all of our region through the winter.
Click on the thumbnail images in the text below to bring up the full-sized graphic
September Precipitation and Temperatures, and Current Drought
September was overall a dry month for our region, with nearly all areas seeing below-average precipitation. Much of Wyoming, northeastern Colorado, and west-central Utah received less than 25% of average precipitation for the month. The only areas with above-average precipitation were in northern Utah, far western Wyoming, and parts of southern Colorado. On a statewide basis, September's precipitation was in the 19th percentile for Colorado, the 48th percentile for Utah, and the 24th percentile for Wyoming.
After a mostly cool July and average August, September was considerably warmer than average, with widespread temperatures of 3–9°F above the monthly normal. Denver (Stapleton) set a new record for warmest September, 5.9°F above normal. Salt Lake City had its 3rd-warmest September, 4.7°F above normal, despite above-average precipitation for the month. On a statewide basis, this was the warmest-ever September for both Colorado and Utah, and the 2nd-warmest September for Wyoming, since the start of the record in 1895.
The latest US Drought Monitor, based on conditions as of October 6, shows that with the very dry conditions since August, several areas in eastern Colorado and eastern Wyoming have degraded to D0 (abnormally dry) in the past month. In northwestern Utah, there has been a one-category improvement due to wetter conditions there. The proportion of Colorado and Wyoming in D2 or worse drought remains at zero; in Utah it is holding steady at 27%.
Water Year 2015 recap
Very dry months in October, January, and March put the regional snowpacks well behind normal conditions in nearly all basins. The "Miracle May" bailed us out of a 2012-type drought scenario, and improved the water supply picture dramatically, though spring runoff was still low in most of Utah and southwestern Colorado. Above-average precipitation in June and July damped down water demand and generated some additional runoff. And then September ended the water year on a very dry note. The final water-year precipitation %-of-average map, showing most of the region ending up with above-average precipitation, presents a benign picture of the roller-coaster ride that actually occurred over the course of the year.
Water year 2015 was also unusually warm across the region. Utah ended up with its 2nd-warmest water year on record, 2.7°F above the 1981–2010 normal, while both Colorado (+1.7°F) and Wyoming (+2.3°F) had their 4th-warmest water years on record. It is notable that these warm anomalies occurred with near-average (Utah) and above-average (Colorado and Wyoming) statewide precipitation; historically, the warmest years in our region have been those with well-below-average precipitation, such as 1934, 1954, 1981, 2000, and 2012.
Current Streamflows
The maps of current streamflows for Colorado, Utah, and Wyoming show that flows are tending towards normal or above normal in Colorado and Wyoming, while in Utah the flows are more spread out among the below-normal, normal, and above-normal classes. As of October 11, the Colorado River near the CO-UT State Line was in the 62nd percentile, 108% of median flow; the Green River at Green River, UT was in the 55th percentile, 108% of median flow; and the San Juan River near Bluff, UT, was in the 27th percentile, 71% of median flow.
Snowpack
The first week of October brought a healthy dollop of moisture to many mountain areas, especially in Colorado and northern Utah. However, it mainly fell as rain, and higher-elevation SNOTEL sites accumulated only a few tenths of an inch of SWE at most. Above 11,000’ more snow fell, but even that may melt out in the next week or two of expected warmer, drier weather. The region’s snowpacks may not begin building in earnest until the first significant snowstorms, perhaps towards the end of October.
Reservoir Storage
In Colorado and Wyoming, nearly all reservoirs were above average for the end of September, with most reservoirs’ storage being ahead of last year at this time, and the remainder being comparable to last year.
In Utah, reservoirs are mainly below average for the end of September, and at similar levels as last year at this time. On September 30, Lake Powell held 12.33 MAF (51% full), almost identical to the storage of 12.29 MAF on the same date last year.
Seasonal Climate and Drought Forecasts, including ENSO
The monthly Climate Outlook for October released on September 30 by NOAA CPC shows a slight wet tilt for precipitation for the southern parts of Utah and Colorado. The seasonal outlooks released September 17 show this area of wet tilt expanding northward, so that for the October–December and November–January periods there is a slight wet tilt for southern Utah, most of Colorado, and southeastern Wyoming, and a moderate wet tilt for southeastern Colorado. This overall forecasted wet-tilted pattern for the region is at least partly due to the expected strong El Niño conditions through the fall and winter.
The experimental PSD precipitation outlook (“SWcast”) issued September 21 also shows a wet tilt for the October–December period, but mainly for southern Utah, and also for far western Colorado and extreme northeastern Colorado. The long-lead SWcast issued October 9 for the January–March period is about as "green" as they come, with a wet tilt across all of Utah and Colorado, with the weakest tilt in western Colorado and the strongest (>+10%) in western Utah. As with the CPC forecasts, the wet tilt is mainly from the El Niño.
The latest CPC Seasonal Drought Outlook released on September 17 projects that areas of drought (D1 or worse) in southern Utah will improve or be removed by the end of December. However, in northern Utah, drought is projected to persist or intensify, with additional drought development expected in the far northwestern corner of Utah, and northwestern Wyoming. Again, these changes are expected mainly due to the forecasted impacts of the El Niño event.
Sea-surface temperatures have continued to warm in the eastern tropical Pacific since early September, while holding steady in the central tropical Pacific. The benchmark Niño 3.4 index is currently at +2.4°C, well above the threshold for strong El Niño conditions, and within 0.5°C of the all-time record set in December 1997 and January 1983. The Multivariate ENSO Index (MEI) climbed again in the August–September period to +2.5, the 2nd-highest value for this time of year since 1950, indicating very strong El Niño conditions.
The IRI/CPC consensus ENSO forecast, base on the mid-September ENSO Prediction Plume, calls for a >95% chance that El Niño conditions will continue through the winter, and a 70% chance for the El Niño to persist for spring 2016.
Previous Briefings
September 14, 2015 (Micro-Briefing)
Highlights
-
August precipitation was below-average overall for the region, with most of Colorado, Wyoming, and western Utah being drier than normal, while northeastern and far southern Utah, and northeastern Wyoming, were much wetter than normal. August temperatures were near average over most of the region, with few departures greater than 2°F.
-
The vast majority of reservoirs in Colorado and Wyoming had above-average storage for the end of August, while most of Utah's reservoirs had below-average storage. As of the end of August, Lake Powell storage was 12.64 MAF, compared to 12.31 MAF on the same date last year.
-
El Niño conditions have increased strength in the past month and by several measures this is now one of the three strongest events since 1950. NOAA CPC precipitation outlooks for our region show a wet tilt through fall and early winter, partly due to El Niño’s expected influence.
August 13, 2015 (Micro-Briefing)
Highlights
-
July precipitation was above normal overall for the region, with southern Utah, western Colorado, and southwestern Wyoming being the wettest areas, and west-central Utah, central Wyoming, and southeastern Colorado much drier than normal. July temperatures were cooler than normal over nearly all of the region.
-
Nearly all reservoirs in Colorado and Wyoming have above-average storage for the end of July; most of Utah's reservoirs have below-average storage. As of the end of July, Lake Powell was at 13.0 MAF, up by about 0.5 MAF from the same date last year.
-
El Niño conditions have maintained strength in the past month and are expected to continue through early spring. NOAA CPC precipitation outlooks for our region show a wet tilt through the late summer and fall, partly due to El Niño’s expected influence.
July 13, 2015
Highlights
-
June precipitation was hit-or-miss across the region; southeastern Utah and southwestern Colorado were much wetter than normal, and northern Utah was drier than normal. June temperatures were record-high in Utah, and also above-average across Colorado and Wyoming.
-
Due to the very wet May and the delayed and rapid snowmelt, peak discharges and overall runoff volumes were generally greater than one would expect given the peak SWE values.
-
Nearly all reservoirs in Colorado and Wyoming have above-average storage for the end of June; Utah's reservoirs are split between below- and above-average storage.
-
El Niño conditions have strengthened further and are expected to continue through the winter. NOAA CPC precipitation outlooks for our region show a wet tilt through the summer and early fall, partly due to El Niño’s expected influence.
Click on the thumbnail images in the text below to bring up the full-sized graphic
June Precipitation and Temperatures, and Current Drought
“Miracle May" was a hard act to follow, precipitation-wise. June reverted to a more typical pattern for our region, with distinct “haves” and “have-nots”; region-wide, precipitation was slightly above average. Due to two landfalling Pacific tropical cyclones and the timely onset of the monsoon, the “haves” were southeastern Utah and southwestern Colorado, with over 400% of average precipitation for the month in some areas. Other areas with above-average precipitation included the rest of southern Utah, central and northeastern Colorado, and northeastern Wyoming. The northern half of Utah, northwestern and southeastern Colorado, and much of western Wyoming were drier than average.
On a statewide basis, June's precipitation was in the 78th percentile for Colorado, the 69th percentile for Utah, and the 54th percentile for Wyoming.
After a cool May, summer heat came on full-bore in June, with most areas recording 2–8°F above the monthly normal. Utah experienced its record-warmest June statewide, with Salt Lake City also setting a new record for the month, 7.8°F above normal. Wyoming was just behind, in the 98th percentile for June temperatures; Colorado was in the 89th percentile.
The latest US Drought Monitor US Drought Monitor, based on conditions as of July 7, shows several areas of improvement since early June. Portions of southeastern Utah and southwestern Colorado improved by 1 to 2 categories. Improvements of 1 category occurred in northeastern Utah and extreme southeastern Colorado. The proportion of Colorado and Wyoming in D2 or worse drought remains at zero; in Utah it decreased from 34% to 27%.
Current Streamflows
As of July 10, the maps of current streamflows for Colorado, Utah, and Wyoming show that flows are tending towards normal or above normal in Colorado and Wyoming, while in Utah the flows are more spread out among the below-normal, normal, and above-normal classes. Flows on the larger streams and rivers are heading down the declining limb of the hydrograph from peaks that occurred in mid- to late June in most basins. As of July 8, the Colorado River near the CO-UT State Line was in the 71st percentile, 202% of median flow; the Green River at Green River, WY was in the 58th percentile, 130% of median flow; and the San Juan River near Bluff, UT, was in the 58th percentile, 131% of median flow.
Snowmelt and Spring Runoff Recap
This was an unusual spring snowmelt and runoff season by any measure. After a warm and dry early spring, most basins saw well-above-average precipitation from mid-April through May, with the new accumulation keeping pace with the melt at many high-elevation sites in Colorado and Wyoming. Peak SWE and the onset of melt occurred early, in March and early April, in many basins, but then the melt season was extended over an unusually long period. And while that peak SWE was below-average in most basins, the peak daily discharges during the runoff season were typically above-average—consistent with a much larger snowpack. Likewise, the seasonal runoff volumes have generally been larger than one would expect from the peak SWE measurements, and even running ahead of the June 1 forecasts which themselves significantly higher than the May 1 forecasts. As of July 9, the observed runoff volumes had already exceeded the CBRFC's June 1 forecasts for April–July runoff at most points in the Upper Colorado River Basin. What this points out is that all SWE is not created equal; precipitation that falls on the snowpack in April, May and June—whether as snow or rain—is more likely to contribute to runoff than precipitation falling earlier in the winter.
Reservoir Storage
In Colorado and Wyoming, nearly all reservoirs were above average for end-of-June, with most reservoirs’ storage being ahead of last year at this time, and the remainder being comparable to last year. Most of Colorado’s large reservoirs (>100 KAF capacity) are full, with Blue Mesa Reservoir filling for the first time since 2011. All of Wyoming’s large reservoirs are at least 85% full.
In Utah, reservoirs in the eastern Great Basin, including the Wasatch Front, are mainly below average for the end of June, and at similar levels as last year at this time. In the Upper Colorado River Basin, reservoirs are mainly above average, and at higher levels than last year. On June 30, Lake Powell held 13.08 MAF (53% full), which is more than the 11.76 MAF (48% full) of storage on the same date in 2014, but still well below the 15.29 MAF (63% full) in 2013.
Seasonal Climate and Drought Forecasts, including ENSO
The monthly Climate Outlook for July released on June 30 by NOAA CPC shows a significant wet tilt for precipitation over all of Utah and Colorado, and southern Wyoming, including a very strong wet tilt for southeastern Utah and extreme southwestern Colorado. The seasonal outlooks released June 18 show similar patterns, with moderate wet tilts for the July–September and August–October periods for nearly all of the region, and stronger wet tilts over Colorado and Utah. This overall forecasted wet-tilted pattern for the region is partly due to the expected moderate to strong El Niño conditions through the summer into the fall.
The experimental PSD precipitation outlook (“SWcast”) released June 16 is not as optimistic about a wet July–September period for our region; in fact, the skill-masked map shows only a slight welt tilt for far eastern Colorado, as well as a dry tilt for northern Utah. The non-skill-masked version does show a moderate wet tilt for the Front Range.
The latest CPC Seasonal Drought Outlook released on June 18 projects that areas of drought (D1 or worse) in Utah will persist or intensify by the end of September. The small patch of D1 in western Colorado shown in the outlook as “removal likely” has already improved since June 18. No additional areas of drought development in the region are expected.
Warm sea-surface temperatures have again strengthened in the eastern tropical Pacific since early June, while dipping slightly in the central tropical Pacific. The benchmark Niño 3.4 index is at +1.4°C, just below the threshold for strong El Niño conditions. The Multivariate ENSO Index (MEI) also jumped in the May–June period to the 3rd-highest value for this time of year since 1950, clearly indicating strong El Niño conditions. Nearly all ENSO model forecasts, compiled by IRI in the mid-June ENSO Prediction Plume, project that El Niño conditions will continue through the summer, with 85% calling for persistence through the winter.
June 11, 2015
Highlights
-
An extraordinarly wet May has dramatically improved drought conditions and the outlook for spring-summer runoff across the region. But runoff is still expected to be below average or much below average at most forecast points outside of central and eastern Colorado.
-
May precipitation was greater than 200% of average over most of the region, with record-wet conditions at many locations.
-
With the cool and wet weather, significant snow persisted at high-elevation sites in Colorado and Wyoming through May, delaying and enhancing the expected runoff.
-
The June 1 spring-summer runoff forecasts from NOAA CBRFC are much higher than the May 1 forecasts for the Upper Colorado River Basin and eastern Great Basin.
-
El Niño conditions have continued to strengthen and are expected to continue through the winter. Seasonal precipitation outlooks for our region show a wet tilt through the summer, partly due to El Niño’s expected influence.
Click on the thumbnail images in the text below to bring up the full-sized graphic
May Precipitation and Temperatures, and Current Drought
In late April the weather pattern shifted to one bringing frequent moist systems to the region. Unusually, the pattern persisted for several weeks, and so the rain and snow kept coming. And coming. And not just in a few places. Nearly the entire region received more than 200% of average precipitation for the month. The wettest areas, with over 400% of average, were southwestern Utah and portions of west-central and northwestern Utah. The driest areas—relatively—were in northern and eastern Wyoming, where “only” 125–200% of average precipitation fell. The moisture was particularly welcome in the context of the overall dry winter conditions; Salt Lake City saw as much precipitation in May (4.19”, 215% of average) as in January, February, March, and April combined.
On a statewide basis, it was the record-wettest May in Colorado (record begins in 1895), with an area–averaged 5.27” of precipitation, 261% of average. May was just shy of the wettest on record in Utah (99th percentile) and Wyoming (97th percentile). For the 3-state region as a whole, it appears that this was the wettest May on record, edging out May 1995 and May 1957. In those two years, the very heavy May precipitation occurred after a wet winter, unlike this year.
As one would expect, the very wet weather in May was accompanied by below-average temperatures, with nearly all locations ending up 2–6°F below the monthly normal. For statewide average temperatures for May, Utah was in the 36th percentile; Wyoming, the 32nd percentile; and Colorado, the 19th percentile.
The latest US Drought Monitor US Drought Monitor, based on conditions as of June 2, shows widespread improvement since early May, especially in Colorado. Southeastern Colorado is nearly drought-free after improving by 1 to 3 categories. Improvements of 1 or 2 categories occurred in western Colorado, southwestern Wyoming, and northeastern Utah. The proportion of Colorado in D2 or worse drought plummeted from 32% last month to zero; in Utah it decreased from 46% to 34%; and Wyoming lost its smidgen of D2 drought and is also at zero.
Current Streamflows
As of June 8, the maps of current streamflows for Colorado, Utah, and Wyoming show that flows are generally above normal or much above normal in Colorado and Wyoming, with several gages in the South Platte Basin at record high flow for the date. In Utah the flows are either normal or in the below-normal classes. For the most part, flows on larger streams and rivers in Colorado and Wyoming are still ramping up towards their seasonal peaks. On June 8, the Colorado River near the CO-UT State Line was in the 71st percentile, 154% of median flow; the Green River at Green River, WY was in the 63rd percentile, 144% of median flow; and the San Juan River near Bluff, UT, was in the 52nd percentile, 103% of median flow.
Current Snowpack
The Current Basin Snowpack map from NRCS as of June 8 needs to be taken with a grain of salt this late in the season, since this a time when most SNOTEL sites have typically melted out or are well on their way. But the very high % of median values for most basins in Colorado, and several in Wyoming, do reflect the unusual late-season trajectory of the high-elevation snowpack in those two states: as snow kept falling in the mountains through May, it offset the melt that occurred, and high-elevation sites either declined slowly, held steady, or showed increases in SWE from May 1 to June 1. Since June 1, with warmer temperatures, rapid melt has occurred at all sites.
According to the Colorado Dust-on-Snow program, this season’s three dust events—an unusually low number—have produced a merged dust layer that is exposed in many areas of western Colorado but is “comparatively weak.” Accordingly, the dust is expected to have only a modest influence on the remaining snowmelt, and runoff.
Spring-Summer Streamflow Forecasts
Normally we don't see dramatic changes in forecasted spring-summer streamflows after May 1—but this is not a normal year. The June 1 forecasts from NOAA CBRFC for the Upper Colorado River Basin and the eastern Great Basin show large increases in expected April–July runoff compared to the May 1 forecasts, generally by 15–40 percentage points. For example, the June 1 forecast for spring-summer Lake Powell inflows is 5000 KAF, 70% of average, well above the May 1 forecast of 3000 KAF, 42% of average. Overall, the May precipitation has boosted the 2015 runoff picture from “grim” to “not so bad, considering.” (Note: NRCS does not produce official forecasts after May 1 so the Westwide NRCS Streamflow Forecast map has not been updated; see the CBRFC's special June water supply webinar for more information on their June 1 forecasts.)
Seasonal Climate and Drought Forecasts, including ENSO
The monthly Climate Outlook for Junereleased on May 31 by NOAA CPC shows a significant wet tilt for precipitation over most of Colorado and southeastern Wyoming, and a slight wet tilt for the rest of Wyoming and Utah. The seasonal outlooks released May 21 show similar patterns, with moderate wet tilts for the June–August and July–September periods for much of the region. This overall forecasted wet-tilted pattern for the region is partly due to the expected moderate to strong El Niño conditions through the summer.
The latest CPC Seasonal Drought Outlook released on May 21 projects that areas of drought conditions (D1 or worse) will improve or be removed by the end of August in northern and eastern Utah, western Colorado, southeastern Colorado, and southwestern Wyoming. Drought areas in western Utah are expected to persist or intensify. No additional areas of drought development in the region are expected.
Sea-surface temperatures anomalies have continued to strengthen in the central and eastern tropical Pacific, shifting from moderate to strong El Niño conditions. The Multivariate ENSO Index (MEI) likewise increased again in the April–May period, also into moderate-to-strong El Niño territory. Nearly all ENSO model forecasts, compiled by IRI in the mid-May ENSO Prediction Plume, project that El Niño conditions will continue at least through the summer, with 80% calling for persistence through the winter.
May 12, 2015
Highlights
-
While April was overall wetter and cooler than the previous three months, and May has gotten off to a wet start, very poor runoff is still expected in most basins across the region.
-
April precipitation was well-above-average in some areas, and below-average in others. The first part of May has been very wet so far over most of the region.
-
Snowpacks in most basins peaked 4–6 weeks early and are well along towards meltout, with many individual SNOTEL sites at lower and middle elevations having already melted out.
-
The May 1 spring-summer runoff forecasts are even lower than the April 1 forecasts in most basins. Most points are expected to see much-below-average (50–69%), far-below-average (25–49%) or extremely low (<25%) runoff, especially in Utah.
-
El Niño conditions have strengthened further and are expected to continue into the winter. A wet tilt in seasonal precipitation through the summer is forecasted for our region, largely due to El Niño’s influence.
Click on the thumbnail images in the text below to bring up the full-sized graphic
April Precipitation and Temperatures, and Current Drought
April precipitation was quite variable around the region. Many of the areas that have had consistently dry conditions this water year were dry again in April, including southwestern Colorado, much of southern Utah, northeastern Utah, and northeastern Wyoming. Central and southeastern Wyoming, central and northeastern Colorado, and east-central Utah saw well-above-normal precipitation. Overall, the region’s mountain areas were split between wet and dry. On a statewide basis, April precipitation came out as near average in all three states: Utah was in the 40th percentile, Colorado was in the 66th percentile, and Wyoming in the 60th percentile.
A very wet weather pattern that began the last week of April has continued into May, bringing well-above-normal precipitation to nearly all of Utah and Colorado, and southern Wyoming. While this weather has been beneficial in replenishing soil moisture, slowing snowmelt, and reducing early-season irrigation demand, it is “too little, too late” with respect to the overall regional water-supply picture.
The temperatures in April were generally above average, but the warm anomalies were not nearly as unusual as in the previous three months. Most of the region saw temperatures within 2°F of the monthly normal. The statewide average temperatures for April were similar among the three states relative to the respective long-term records: Utah was in the 68th percentile; Wyoming, the 73rd percentile; and Colorado, the 77th percentile.
The latest US Drought Monitor, based on conditions as of May 5, shows that since early April, there has been some degradation in southwestern Wyoming, from D0 (abnormally dry) to moderate drought (D1) and in northeastern Wyoming, from drought-free to D0. But other areas saw improvement, including an area in west-central Utah in far western Colorado that went from D2 to D1, and in northeastern Colorado from D0 to drought-free. The proportion of Utah in D2 or worse drought decreased from 52% last month to 46%; likewise in Colorado, which dropped from 40% to 32%. Wyoming remained at 1%.
Current Streamflows
As of May 11, the maps of current streamflows for Colorado, Utah, and Wyoming show that flows are generally above normal or much above normal in Colorado and Wyoming, with several gages in the Arkansas and South Platte Basins at record high flow for the date after a very rainy week. In Utah the flows are more distributed across the below-normal, normal, and above-normal classes, with normal flows predominating. For the most part, flows on larger streams and rivers across the region are still rising towards their seasonal peak flows, but many streams in Utah have already seen the pulse of snowmelt runoff. On May 11, the Colorado River near the CO-UT State Line was in the 66th percentile, 131% of median flow; the Green River at Green River, UT was in the 40th percentile, 88% of median flow; and the San Juan River near Bluff, UT, was in the 12th percentile, 34% of median flow.
Current Snowpack
The Current Basin Snowpack map from NRCS as of May 11 continues to paint a bleak picture, with only three basins at more than 80% of median SWE for the date, and many basins below 50%. The worst conditions are in Utah, where the May 1 statewide snowpack was record-low at 23% of normal. Across the region, the snowpack peaked early at well-below-normal levels in most locations, and melt has been proceeeding for 4–6 weeks. Many low- and mid-elevation sites have nearly or completely melted out, well ahead of normal meltout. Some sites in northern Utah for which median SWE is over 20” in early May are down to their last dregs. The exceptions to the regional picture are the Arkansas and South Platte basins, which have been favored by upslope storms in the late winter and spring, including a very wet start to May, and the snowpack is just above 100% of median SWE.
According to the Colorado Dust-on-Snow program, even after a third and more substantial event in mid-April, the total seasonal dust-on-snow deposition in Colorado has been lighter than in recent seasons. In northern Utah, that same mid-April storm system deposited substantial dust on what snow remained in the Wasatch, per Jim Steenburgh's Wasatch weather blog.
Spring-Summer Streamflow Forecasts
In the May 1 spring-summer streamflow forecasts, released by NOAA CBRFC and the NRCS in early May, the expected runoff declined further at many forecast points relative to the April 1 forecasts. With the very wet conditions in early May, the daily ESP forecasts from NOAA CBRFC as of May 12 show an uptick in many basins, but only back to the April 1 forecasted level at best. Overall, the outlook for regional runoff is still grim—one of the worst five seasons since 1980 in most basins.
The NRCS Westwide Streamflow Forecast Map shows that nearly all forecast points in Utah are still expected to have far-below-average (25–49%) or extremely low (<25%) spring and summer runoff. Most Wyoming and Colorado forecast points are expected to have much-below-average (50–69%), and far-below-average (25–49%) runoff, with a lesser number seeing below-average (70–89%) runoff. Lower flows are expected in southwestern and northwestern Colorado, and central Wyoming, than elsewhere. Only in the South Platte River Basin and the adjacent Colorado River headwaters is near-average (90–109%) spring and summer runoff expected. The Lake Powell seasonal inflow forecast has declined again since April 1, to around 40% of average inflows; see Note below.
IMPORTANT NOTE: While NRCS and NOAA continue to collaborate on streamflow forecasts, the forecast values are no longer being strictly coordinated between NRCS and some of the RFCs, including the CBRFC. For example, the NRCS April 1 forecast for Lake Powell April–July inflows is 2700 KAF, 38% of average. The NOAA CBRFC April 1 forecast for the same point is 3000 KAF, 42% of average.
Seasonal Climate and Drought Forecasts, including ENSO
The monthly Climate Outlook for May released on April 30 by NOAA CPC shows a moderate wet tilt for precipitation for all of Colorado, and a slight wet tilt for most of Wyoming and Utah. The seasonal outlooks released April 16 show a moderate wet tilt in both the May–July and June–August periods for nearly all of the region. Much of this overall forecasted pattern of wet tilt in the region US is associated with the expected persistence of El Niño conditions.
The latest CPC Seasonal Drought Outlook ![]() released on April 16 projects that areas of drought conditions (D1 or worse) will improve or be removed by the end of July in northern Utah, western Colorado, and southeastern Colorado. Drought areas in southern Utah and the San Luis Valley of Colorado are expected to persist or intensify. No additional areas of drought development in the region are expected.
released on April 16 projects that areas of drought conditions (D1 or worse) will improve or be removed by the end of July in northern Utah, western Colorado, and southeastern Colorado. Drought areas in southern Utah and the San Luis Valley of Colorado are expected to persist or intensify. No additional areas of drought development in the region are expected.
The updated Experimental PSD Seasonal Precipitation Forecast Guidance ('SWcast') for the April–June period issued on April 14 is very similar to the initial forecast released in mid-March. It shows a tilt towards above-average precipitation over most of eastern, central, and southwestern Colorado, and northern Utah. The wet tilt is strongest in east-central Colorado. There is a slight dry tilt forecasted for the far northeastern corner of Colorado. (Note: "Skill-masked" means that the forecast only shows the tilts for those areas where there has been demonstrated forecast skill for this season in the past.)
Sea-surface temperatures anomalies have recently strengthened in across the tropical Pacific, and are now indicative of moderate El Niño conditions. The Multivariate ENSO Index (MEI) likewise jumped in the March–April period into moderate El Niño territory. There is a stronger consensus from the ENSO model forecasts, compiled by IRI in the mid-April ENSO Prediction Plume, that El Niño conditions will continue at least through the summer, with 70% calling for persistence into the winter.
April 10, 2015
Highlights
-
March was disastrous for the region’s snowpack and the expected spring–summer runoff. Snow conditions and forecasted runoff are now similar to 1977, 2002, and 2012 in many parts of the region, particularly in Utah.
-
March brought a double-whammy of well-below-average precipitation and near-record warmth over most of the region, including nearly all mountain areas.
-
Since early March, the snowpack has significantly declined relative to normal conditions across the region. Most basins are now reporting less than 70% of median SWE, and the majority of individual SNOTEL sites are below the 5th percentile for SWE.
-
The April 1 spring-summer runoff forecasts are lower or much lower than the March 1 forecasts across the region. Most forecast points are now expected to see much-below-average (50–69%), far-below-average (25–49%) or extremely low (<25%) runoff, with Utah seeing generally lower forecasts than Colorado and Wyoming.
-
El Niño conditions have strengthened slightly in the last month and are expected to continue at least through the summer. The wet tilt in seasonal precipitation forecasts for parts of our region is predicated on a typical El Niño influence over the next several months.
Click on the thumbnail images in the text below to bring up the full-sized graphic
March Precipitation and Temperatures, and Current Drought
March was drier than average over nearly the entire region. Storms were infrequent and when they did occur, they moved through the region quickly, and were warmer than normal. Most mountain areas received 25–75% of average precipitation, with the Wasatch Range seeing yet another very dry month with 25–50% of average. The few wet spots in the region included south-central Wyoming, and southwestern Utah.
For the month, Utah was in the 26th percentile for statewide precipitation, Colorado was in the 17th percentile for statewide precipitation, and Wyoming was the driest of the three states, in the 4th percentile.
More extraordinary than the low precipitation were the abnormally warm temperatures in March, with most of the region seeing temperatures 4–8°F warmer than the monthly normals. For comparison, typically April is 7–9°F warmer than March across the region, so March 2015 was more like a normal April than a normal March. Once again, the warmest areas were in northern Utah and southwestern Wyoming, along with parts of southern and northeastern Wyoming. Salt Lake City followed the warmest winter season (December–February) on record with its record-warmest March.
The statewide average temperatures for March were close to record warmth in all three states: Utah, 98th percentile; Wyoming, 97th percentile; and Colorado, 96th percentile. Overall, the January–March period was the warmest on record for both Utah and Wyoming, and in the 97th percentile for Colorado. Since the beginning of the 2015 water year, only November has been colder than average across the region.
The latest US Drought Monitor, based on conditions as of April 7, shows that since early March, conditions over most of western Colorado and adjacent eastern and northern Utah have continued to degrade, from moderate drought (D1) to severe drought (D2). An area of severe drought (D2) in northwestern Utah has greatly expanded, and the area in extreme drought (D3) has likewise increased. Far western Wyoming went from drought-free to abnormally dry (D0), as did an area in north-central Colorado. The proportion of Utah in D2 or worse drought has increased dramatically from 13% last month to 53%; likewise in Colorado, which went from 12% to 40%. Wyoming has seen a slight bump from zero to 1%.
Current Streamflows
As of April 6, the maps of current streamflows for Colorado, Utah, and Wyoming show that flows are generally above normal or much above normal in Colorado and Wyoming, with several gages in the Colorado River headwaters at record high flow for the date. In Utah nearly all of the flows are in the normal and below-normal classes. Where above-normal flows are occurring in the region, it is an indication of the widespread premature snowmelt and runoff. On April 6, the Colorado River below Glenwood Springs, CO was in the 85th percentile, 141% of median flow; the Green River near Greendale, UT was in the 59th percentile, 121% of median flow; and the San Juan River near Bluff, UT, was in the 23rd percentile, 56% of median flow.
Current Snowpack
Between the well-below-average precipitation and extremely warm temperatures, the region’s snowpack has taken a real beating since early March. The Current Basin Snowpack map from NRCS as of April 8 shows that all of the region’s basins are below 90% of median SWE, and over two-thirds of them are below 70% of median SWE. At the majority of SNOTEL sites across the region, current SWE is below the 5th percentile relative to the last 20–40 years, and 28 sites are at record-low levels, mostly in Utah. Many sites at lower elevations in Utah have melted out completely, and most other sites across the region have seen significant melt in the past few weeks, up to a month ahead of the usual initiation of melt.
Field observers with the Colorado Dust-on-Snow program in mid-March found nearly isothermal temperature profiles (i.e., 32°F from top to bottom) within the snowpack across Colorado's mountains—a precondition for spring melt-—much earlier than usual. They also noted larger-than-usual differences between snow conditions on south- and north-facing slopes, with very thin cover or bare ground on many south-facing slopes, even at high elevations. This observation raised the concern that the SNOTEL network may be overestimating actual SWE on the landscape this spring. About the only good news for the snowpack was that dust-on-snow deposition in Colorado has thus far been much lighter than in recent seasons, with only two weak events in the San Juans.
Spring-Summer Streamflow Forecasts
In the April 1 spring-summer streamflow forecasts, released by NOAA CBRFC and the NRCS in early April, the expected runoff has dropped substantially compared to the March 1 forecasts across the region. Regionally, the outlook is for an extremely poor runoff season, along the lines of 1977, 2002, and 2012 in most basins.
The NRCS Westwide Streamflow Forecast Map shows that nearly all forecast points in Utah are now expected to have far-below-average (25–49%) or extremely low (<25%) spring and summer runoff. Wyoming and Colorado forecast points are split between below-average (70–89%), much-below-average (50–69%), and far-below-average (25–49%) runoff, with the lower flows expected in southwestern Colorado and central Wyoming than elsewhere. Only a few scattered forecast points in Colorado and Wyoming are now expected to have near-average (90–109%) spring and summer runoff. The Lake Powell inflow forecast has declined dramatically since March 1, to around 50% of average; see the Note below.
Whatever April–July runoff does occur, we also can expect that the hydrograph and its peak will likely be shifted earlier by 1-4 weeks or more compared to average conditions, depending on how the weather plays out over the next three months.
IMPORTANT NOTE: While NRCS and NOAA continue to collaborate on streamflow forecasts, the forecast values are no longer being strictly coordinated between NRCS and some of the RFCs, including the CBRFC. For example, the NRCS April 1 forecast for Lake Powell April–July inflows is 3200 KAF, 45% of average. The NOAA CBRFC April 1 forecast for the same point is 3750 KAF, 52% of average.
Seasonal Climate and Drought Forecasts, including ENSO
The monthly Climate Outlook for April released on March 31 by NOAA CPC shows a dry tilt for precipitation in the northern Great Plains, extending into northeastern Colorado and eastern Wyoming. The seasonal outlooks released March 19 show a slight wet tilt in both the April–June ![]() and May–July
and May–July ![]() periods for most of the region, with a stronger wet tilt for southwestern Colorado. The overall pattern of wet tilt in the southwestern and southeastern US is associated with El Niño conditions.
periods for most of the region, with a stronger wet tilt for southwestern Colorado. The overall pattern of wet tilt in the southwestern and southeastern US is associated with El Niño conditions.
The latest CPC Seasonal Drought Outlook ![]() released on March 19 projects that areas of drought conditions (D1 or worse) in southeastern Colorado will improve or be removed by the end of June. Drought areas in Utah and the rest of western Colorado are expected to persist or intensify. No additional areas of drought development in the region are expected.
released on March 19 projects that areas of drought conditions (D1 or worse) in southeastern Colorado will improve or be removed by the end of June. Drought areas in Utah and the rest of western Colorado are expected to persist or intensify. No additional areas of drought development in the region are expected.
The Experimental PSD Seasonal Precipitation Forecast Guidance ('SWcast') for the April–June period ![]() issued on March 16 shows a tilt towards above-average precipitation over most of eastern and southwestern Colorado, and northwestern Utah. The wet tilt is strongest on the eastern plains of Colorado. There is a slight dry tilt forecasted for the far northeastern corner of Colorado. The pattern is similar to that seen in a composite of past spring seasons with weak El Niño conditions. (Note: "Skill-masked" means that the forecast only shows the tilts for those areas where there has been demonstrated forecast skill for this season in the past.)
issued on March 16 shows a tilt towards above-average precipitation over most of eastern and southwestern Colorado, and northwestern Utah. The wet tilt is strongest on the eastern plains of Colorado. There is a slight dry tilt forecasted for the far northeastern corner of Colorado. The pattern is similar to that seen in a composite of past spring seasons with weak El Niño conditions. (Note: "Skill-masked" means that the forecast only shows the tilts for those areas where there has been demonstrated forecast skill for this season in the past.)
In the tropical Pacific region, weak El Niño conditions continue, with some recent warming of sea-surface temperatures in the diagnostic regions of the tropical Pacific. The Multivariate ENSO Index (MEI) rose slightly in the February–March period ![]() but remains in weak El Niño territory. A slight majority (50-60%) of the individual ENSO model forecasts compiled by IRI in the mid-March ENSO Prediction Plume
but remains in weak El Niño territory. A slight majority (50-60%) of the individual ENSO model forecasts compiled by IRI in the mid-March ENSO Prediction Plume ![]() call for El Niño conditions to continue through summer 2015. The dynamical models as a group call for strengthening El Niño conditions, while the statistical models generally favor weakening.
call for El Niño conditions to continue through summer 2015. The dynamical models as a group call for strengthening El Niño conditions, while the statistical models generally favor weakening.
March 11, 2015
Highlights
-
February’s precipitation was very unevenly distributed across the region. Most of Colorado, especially the Front Range, saw much-wetter-than-average conditions, while Utah was overall very dry, especially in the northern part of the state.
-
Since early February, the snowpack has improved relative to normal conditions in several basins, including in southwestern Colorado, while slipping in several others, particularly in northern Utah. Regionwide, the majority of basins are still reporting below-normal SWE (<90% of median).
-
The March 1 spring-summer runoff forecasts came in lower than the February 1 forecasts at many locations. Most forecast points are expected to see below-average and much-below-average runoff, with an increasing number in the dreaded far-below-average (25–49%) category, especially in Utah.
-
Finally: The Niño 3.4 sea-surface temperature anomaly has managed to remain above the +0.5°C threshold for the requisite period, and so NOAA last week issued an El Niño Advisory. These borderline El Niño conditions are expected to continue at least through the spring, with strengthening possible.
Click on the thumbnail images in the text below to bring up the full-sized graphic
February Precipitation and Temperatures, and Current Drought
After a big storm in the first week, the next ten days of February reverted to the overall dry weather of January. Then the upper-level pattern shifted again, and several more storms came through the region, but with very uneven results ![]() . Most of eastern Colorado ended up with much-above-average (>200% of normal) precipitation for the month, with record February precipitation and snowfall in several locations on the Front Range. South-central Colorado, southeastern Utah, and central Wyoming were also on the wet side. Northwestern Colorado, northern and central Utah, and western Wyoming saw below-average or well-below-average precipitation, with parts of the Wasatch Range experiencing the least-snowy February on record.
. Most of eastern Colorado ended up with much-above-average (>200% of normal) precipitation for the month, with record February precipitation and snowfall in several locations on the Front Range. South-central Colorado, southeastern Utah, and central Wyoming were also on the wet side. Northwestern Colorado, northern and central Utah, and western Wyoming saw below-average or well-below-average precipitation, with parts of the Wasatch Range experiencing the least-snowy February on record.
For the month, Colorado was in the 75th percentile for statewide precipitation—the wettest state in the country relative to normal in an overall dry February nationwide. Wyoming was not far behind in the 61st percentile, while Utah was the driest of the three states, in the 24th percentile.
February continued what has been a very warm winter for the region, with above-average temperatures observed for the month in all but a few locations ![]() . As in December and January, the warmest areas were in northern Utah, northwestern Colorado, and southwestern Wyoming, with temperatures 9–15°F warmer than the monthly normal. As in January, the region was in or near the top decile for monthly statewide average temperature: Utah, 100th percentile (warmest February on record); Wyoming, 95th percentile; and Colorado, 89th percentile. Salt Lake City ended up with the warmest winter season (December–February) on record.
. As in December and January, the warmest areas were in northern Utah, northwestern Colorado, and southwestern Wyoming, with temperatures 9–15°F warmer than the monthly normal. As in January, the region was in or near the top decile for monthly statewide average temperature: Utah, 100th percentile (warmest February on record); Wyoming, 95th percentile; and Colorado, 89th percentile. Salt Lake City ended up with the warmest winter season (December–February) on record.
The latest US Drought Monitor ![]() , based on conditions as of March 3, shows that since early February, a large area of western Colorado and adjacent eastern and northern Utah has degraded again, from abnormally dry (D0) to moderate drought (D1). An area of severe drought (D2) in northwestern Utah has slightly expanded, and a portion of it has degraded to extreme drought (D3). The proportion of the region in D2 or worse drought is unchanged, with Utah at 13%, Colorado at 12%, and Wyoming at zero.
, based on conditions as of March 3, shows that since early February, a large area of western Colorado and adjacent eastern and northern Utah has degraded again, from abnormally dry (D0) to moderate drought (D1). An area of severe drought (D2) in northwestern Utah has slightly expanded, and a portion of it has degraded to extreme drought (D3). The proportion of the region in D2 or worse drought is unchanged, with Utah at 13%, Colorado at 12%, and Wyoming at zero.
Current Streamflows
As of March 8, the maps of current streamflows for Colorado ![]() , Utah
, Utah ![]() , and Wyoming
, and Wyoming ![]() show that flows are generally normal to above normal in Colorado and Wyoming, and mainly below normal to normal in Utah. On March 7, the Colorado River below Glenwood Springs, CO was in the 57th percentile, 105% of median flow; the Green River near Greendale, UT was in the 68th percentile, 159% of median flow; and the San Juan River near Bluff, UT, was in the 41st percentile, 87% of median flow.
show that flows are generally normal to above normal in Colorado and Wyoming, and mainly below normal to normal in Utah. On March 7, the Colorado River below Glenwood Springs, CO was in the 57th percentile, 105% of median flow; the Green River near Greendale, UT was in the 68th percentile, 159% of median flow; and the San Juan River near Bluff, UT, was in the 41st percentile, 87% of median flow.
Current Snowpack
After the very uneven distribution of precipitation in February, some basins saw gains in snowpack compared to normal seasonal accumulation, while other basins regressed. The Current Basin Snowpack map from NRCS ![]() as of March 11 shows that like one month ago, the majority of the region’s basins are below 90% of median SWE. Northern Utah now generally has the lowest basin snowpacks, with 55–77% of median SWE. Above-median SWE is reported in several basins in northern and western Wyoming, in south-central Utah, and in eastern Colorado, but only two basins have more than 110% of median.
as of March 11 shows that like one month ago, the majority of the region’s basins are below 90% of median SWE. Northern Utah now generally has the lowest basin snowpacks, with 55–77% of median SWE. Above-median SWE is reported in several basins in northern and western Wyoming, in south-central Utah, and in eastern Colorado, but only two basins have more than 110% of median.
Spring-Summer Streamflow Forecasts
In the March 1 spring-summer streamflow forecasts, released by NOAA CBRFC and the NRCS in early March, the expected runoff has slipped at many gages across the regions compared to the February 1 forecasts. The NRCS Westwide Streamflow Forecast Map ![]() shows that most forecast points in Utah are now expected to have much-below-average (50–69%) or far-below-average (25–49%) spring and summer runoff. Central and southern Wyoming and northwestern and southern Colorado are expected to have below-average (70–89%) or much-below-average (50–69%) runoff. Most forecast points in northern and central Colorado and northern and western Wyoming are expected to have near-average (90–109%) spring and summer runoff. The Lake Powell inflow forecast has declined slightly since February 1; see Note below.
shows that most forecast points in Utah are now expected to have much-below-average (50–69%) or far-below-average (25–49%) spring and summer runoff. Central and southern Wyoming and northwestern and southern Colorado are expected to have below-average (70–89%) or much-below-average (50–69%) runoff. Most forecast points in northern and central Colorado and northern and western Wyoming are expected to have near-average (90–109%) spring and summer runoff. The Lake Powell inflow forecast has declined slightly since February 1; see Note below.
IMPORTANT NOTE: While NRCS and NOAA continue to collaborate on streamflow forecasts, the forecast values are no longer being strictly coordinated between NRCS and some of the RFCs, including the CBRFC. For example, the NRCS March 1 forecast for Lake Powell April–July inflows is 4900 KAF, 68% of average. The NOAA CBRFC March 1 forecast for the same point is 5100 KAF, 71% of average.
Seasonal Climate and Drought Forecasts, including ENSO
The monthly Climate Outlook for March ![]() released on February 28 by NOAA CPC shows a wet tilt for precipitation in the Four Corners, extending into western Colorado and eastern Utah. The seasonal outlooks released February 19 show a wet tilt in both the March–May
released on February 28 by NOAA CPC shows a wet tilt for precipitation in the Four Corners, extending into western Colorado and eastern Utah. The seasonal outlooks released February 19 show a wet tilt in both the March–May ![]() and April–June
and April–June ![]() periods for most of the region, with the strongest tilt in western Colorado and eastern Utah.
periods for most of the region, with the strongest tilt in western Colorado and eastern Utah.
Given this wet tilt, the latest CPC Seasonal Drought Outlook ![]() released February 19 projects that areas of drought conditions (D1 or worse) in southeastern Colorado and in far northwestern Colorado and southwestern Wyoming will improve or be removed by the end of May. Drought areas in Utah and the rest of western Colorado are expected to persist or intensify. No additional areas of drought development in the region are expected.
released February 19 projects that areas of drought conditions (D1 or worse) in southeastern Colorado and in far northwestern Colorado and southwestern Wyoming will improve or be removed by the end of May. Drought areas in Utah and the rest of western Colorado are expected to persist or intensify. No additional areas of drought development in the region are expected.
As reported in last month's briefing, the updated Experimental PSD Seasonal Precipitation Forecast Guidance ('SWcast') for the January–March period ![]() issued on January 15 continues to show a tilt towards above-average precipitation over most of Colorado and southern Utah. There is again a slight dry tilt forecasted for northern Utah. (Note: "Skill-masked" means that the forecast only shows the tilts for those areas where there has been demonstrated forecast skill for this season in the past.)
issued on January 15 continues to show a tilt towards above-average precipitation over most of Colorado and southern Utah. There is again a slight dry tilt forecasted for northern Utah. (Note: "Skill-masked" means that the forecast only shows the tilts for those areas where there has been demonstrated forecast skill for this season in the past.)
As also reported in last month's briefing, the median forecast of the Experimental PSD April 1 SWE Guidance ![]() issued on January 15 suggests that the Colorado River Headwaters will end up with above-normal SWE by April 1, with 103% of median, while the Gunnison and Rio Grande will be well below median, with 84%, with the other five basins falling in between with 90% to 96% of median.
issued on January 15 suggests that the Colorado River Headwaters will end up with above-normal SWE by April 1, with 103% of median, while the Gunnison and Rio Grande will be well below median, with 84%, with the other five basins falling in between with 90% to 96% of median.
In the tropical Pacific region, the halting shuffle towards El Niño conditions has finally met the official criteria. On March 5, NOAA CPC issued an El Niño Advisory, noting that overall, the indicators “are consistent with borderline, weak El Niño conditions.” Because of the barely-above-threshold conditions, and the unusual timing for onset (typically in summer), the climate impacts are expected to be modest. The Multivariate ENSO Index (MEI) ![]() continued to hover in weak El Niño territory for the January–February period. A slight majority (50-60%) of the individual ENSO model forecasts compiled by IRI in the mid-February ENSO Prediction Plume
continued to hover in weak El Niño territory for the January–February period. A slight majority (50-60%) of the individual ENSO model forecasts compiled by IRI in the mid-February ENSO Prediction Plume ![]() call for El Niño conditions to continue through spring 2015. The dynamical models are particularly bullish on El Niño continuing and possibly strengthening.
call for El Niño conditions to continue through spring 2015. The dynamical models are particularly bullish on El Niño continuing and possibly strengthening.
February 11, 2015
Highlights
-
January was overall very dry for the region, with nearly all mountain areas receiving below-average precipitation.
-
The region's snowpack has suffered since January 1 due to the dry and warm conditions, with most basins now reporting below-median SWE. Basins in southwestern Colorado and southwestern Utah remain the driest in the region, with less than 65% of median SWE.
-
The February 1 spring-summer runoff forecasts show widespread reductions compared to the January 1 forecasts. Most forecast points are now in the below-average and much-below-average categories, with near-average runoff expected in central Colorado and northern and western Wyoming.
-
"El Limbo" continues in the tropical Pacific; by some measures weak El Niño conditions are occurring, but the likelihood of an official El Niño event has dropped slightly compared to one month ago.
Click on the thumbnail images in the text below to bring up the full-sized graphic
January Precipitation and Temperatures, and Current Drought
In January, most of the region experienced drier-than-average conditions, including nearly all mountain areas ![]() . The driest areas were in western and southern Wyoming, and northwestern and north-central Colorado. Eastern Utah had the only large area with a wet anomaly for January. For the month, Wyoming ended up very dry overall, in the 8th percentile for statewide precipitation, Colorado in the 15th percentile, and Utah closest to normal, in the 33rd percentile.
. The driest areas were in western and southern Wyoming, and northwestern and north-central Colorado. Eastern Utah had the only large area with a wet anomaly for January. For the month, Wyoming ended up very dry overall, in the 8th percentile for statewide precipitation, Colorado in the 15th percentile, and Utah closest to normal, in the 33rd percentile.
As in December, January was warmer than average across nearly the entire region ![]() . Once again, the warmest areas were in northern Utah, northwestern Colorado, and southwestern Wyoming, with temperatures 6–10°F warmer than the monthly normal. All three states were in or near the top decile for monthly statewide average temperature: Utah, 95th percentile; Wyoming, 93rd percentile; and Colorado, 88th percentile.
. Once again, the warmest areas were in northern Utah, northwestern Colorado, and southwestern Wyoming, with temperatures 6–10°F warmer than the monthly normal. All three states were in or near the top decile for monthly statewide average temperature: Utah, 95th percentile; Wyoming, 93rd percentile; and Colorado, 88th percentile.
The latest US Drought Monitor ![]() , based on conditions as of February 3, shows that since early January, a large area of western Colorado and adjacent far eastern Utah has degraded from drought-free to abnormally dry (D0). But the proportion of the region in D2 or worse drought remains the same: Utah at 13%; Colorado at 12%, and Wyoming at zero.
, based on conditions as of February 3, shows that since early January, a large area of western Colorado and adjacent far eastern Utah has degraded from drought-free to abnormally dry (D0). But the proportion of the region in D2 or worse drought remains the same: Utah at 13%; Colorado at 12%, and Wyoming at zero.
Current Streamflows
As of February 10, the maps of current streamflows for Colorado ![]() , Utah
, Utah ![]() , and Wyoming
, and Wyoming ![]() show that for the relatively few gages unaffected by winter icing, flows are normal to above normal in Colorado and Wyoming, and mainly normal or below normal in Utah. Given the warm weather of the last month, the prevalence of normal and above-normal flows may in part be due to premature melt of lower-elevation snowpacks. On February 10, the Colorado River below Glenwood Springs, CO was in the 83rd percentile, 124% of median flow; the Green River near Greendale, UT was in the 57th percentile, 132% of median flow; and the San Juan River near Bluff, UT, was in the 49th percentile, 100% of median flow.
show that for the relatively few gages unaffected by winter icing, flows are normal to above normal in Colorado and Wyoming, and mainly normal or below normal in Utah. Given the warm weather of the last month, the prevalence of normal and above-normal flows may in part be due to premature melt of lower-elevation snowpacks. On February 10, the Colorado River below Glenwood Springs, CO was in the 83rd percentile, 124% of median flow; the Green River near Greendale, UT was in the 57th percentile, 132% of median flow; and the San Juan River near Bluff, UT, was in the 49th percentile, 100% of median flow.
Current Snowpack
With the generally warm and dry weather since January 1, the snowpack has fallen behind normal accumulation across most of the region. The Current Basin Snowpack map from NRCS ![]() as of February 11 shows that majority of the region’s basins are now below 90% of median SWE, with southwestern Colorado and southwestern Utah stuck below 65% of median SWE. Above-median SWE is seen in several basins in northern and western Wyoming, one basin in south-central Utah, and the South Platte Basin in northeastern Colorado.
as of February 11 shows that majority of the region’s basins are now below 90% of median SWE, with southwestern Colorado and southwestern Utah stuck below 65% of median SWE. Above-median SWE is seen in several basins in northern and western Wyoming, one basin in south-central Utah, and the South Platte Basin in northeastern Colorado.
Spring-Summer Streamflow Forecasts
The February 1 spring-summer streamflow forecasts, released by NOAA CBRFC and the NRCS in early February, show widespread reductions in the expected runoff compared to the January 1 forecasts. The NRCS Westwide Streamflow Forecast Map ![]() shows that most forecast points in northern and central Colorado, and northern and western Wyoming are expected to have near-average (90–109%) spring and summer runoff. Most forecast points in central and southern Wyoming, northwestern and southern Colorado, and throughout Utah are expected to have below-average (70–89%) to much-below-average (50–69%) spring and summer runoff. The Lake Powell inflow forecast has fallen by about 20 percentage points since January 1; see Note below.
shows that most forecast points in northern and central Colorado, and northern and western Wyoming are expected to have near-average (90–109%) spring and summer runoff. Most forecast points in central and southern Wyoming, northwestern and southern Colorado, and throughout Utah are expected to have below-average (70–89%) to much-below-average (50–69%) spring and summer runoff. The Lake Powell inflow forecast has fallen by about 20 percentage points since January 1; see Note below.
IMPORTANT NOTE: While NRCS and NOAA continue to collaborate on streamflow forecasts, the forecast values are no longer being strictly coordinated between NRCS and some of the RFCs, including the CBRFC. For example, the NRCS February 1 forecast for Lake Powell April–July inflows is 5000 KAF, 70% of average. The NOAA CBRFC February 1 forecast for the same point is 5200 KAF, 73% of average.
Seasonal Climate and Drought Forecasts, including ENSO
The monthly Climate Outlook for February ![]() released on January 31 by NOAA CPC shows no tilt for precipitation across the region. The seasonal outlooks released January 15 show a wet tilt in both the February–April
released on January 31 by NOAA CPC shows no tilt for precipitation across the region. The seasonal outlooks released January 15 show a wet tilt in both the February–April ![]() and March–May
and March–May ![]() periods for all of Colorado and most of Utah.
periods for all of Colorado and most of Utah.
Given this wet tilt, the latest CPC Seasonal Drought Outlook ![]() released January 15 projects that most areas of drought conditions (D1 or worse) in southern Colorado and in southern Utah will improve or be removed by the end of April. Drought areas in far southeastern Colorado and in northwestern Utah are expected to persist or intensify. No additional areas of drought development in the region are expected.
released January 15 projects that most areas of drought conditions (D1 or worse) in southern Colorado and in southern Utah will improve or be removed by the end of April. Drought areas in far southeastern Colorado and in northwestern Utah are expected to persist or intensify. No additional areas of drought development in the region are expected.
The updated Experimental PSD Seasonal Precipitation Forecast Guidance ('SWcast') for the January–March period ![]() issued on January 15 continues to show a tilt towards above-average precipitation over most of Colorado and southern Utah. There is again a slight dry tilt forecasted for northern Utah. (Note: "Skill-masked" means that the forecast only shows the tilts for those areas where there has been demonstrated forecast skill for this season in the past.)
issued on January 15 continues to show a tilt towards above-average precipitation over most of Colorado and southern Utah. There is again a slight dry tilt forecasted for northern Utah. (Note: "Skill-masked" means that the forecast only shows the tilts for those areas where there has been demonstrated forecast skill for this season in the past.)
The median forecast of the Experimental PSD April 1 SWE Guidance ![]() issued on January 15 suggests that the Colorado River Headwaters will end up with above-normal SWE by April 1, with 103% of median, while the Gunnison and Rio Grande will be well below median, with 84%, with the other five basins falling in between with 90% to 96% of median.
issued on January 15 suggests that the Colorado River Headwaters will end up with above-normal SWE by April 1, with 103% of median, while the Gunnison and Rio Grande will be well below median, with 84%, with the other five basins falling in between with 90% to 96% of median.
In the tropical Pacific region, the awkward movement towards full-blown El Niño conditions has slowed again. The Multivariate ENSO Index (MEI) ![]() remained in weak El Niño territory for the December–January period. The weekly benchmark Niño 3.4 sea-surface temperature (SST) index as of early February is still near the threshold for El Niño conditions, but has declined since December.
remained in weak El Niño territory for the December–January period. The weekly benchmark Niño 3.4 sea-surface temperature (SST) index as of early February is still near the threshold for El Niño conditions, but has declined since December.
A slight majority (50-60%) of the individual ENSO model forecasts compiled by IRI in mid-January ![]() still favor El Niño conditions to emerge in spring 2015; this is about double the climatological odds of El Niño onset for this time of year. If an official El Niño does develop, is likely to be a weak event. The forecasts indicate very little chance of a La Niña event developing before summer 2015.
still favor El Niño conditions to emerge in spring 2015; this is about double the climatological odds of El Niño onset for this time of year. If an official El Niño does develop, is likely to be a weak event. The forecasts indicate very little chance of a La Niña event developing before summer 2015.
January 13, 2015
Highlights
-
December brought above-average statewide precipitation to Wyoming, Colorado, and Utah, with most mountain areas seeing wettter-than-normal conditions.
-
The snowpack has generally improved in the last month, with the majority of the region's basins now reporting above-median SWE. Basins in southwestern Colorado, as well as southwestern and eastern Utah, remain near or below 75% of median SWE.
-
The first spring-summer runoff forecasts for the 2015 season indicate mixed prospects for the region's basins, with mainly normal to above-normal runoff expected in Wyoming and northern and central Colorado, and below-normal to normal runoff for Utah and southern Colorado.
-
The tropical Pacific continues to experience "El Limbo" conditions, though the eventual emergence of a full-blown El Niño event is still expected by most forecast models.
Click on the thumbnail images in the text below to bring up the full-sized graphic
December Precipitation and Temperatures, and Current Drought
In December, drier-than-average conditions in southwestern Colorado, northwestern and eastern Utah, and southern Wyoming were balanced out by areas with above-average precipitation, especially in central Wyoming and central and far eastern Colorado ![]() . For the month, Wyoming ended up in the 77th percentile for statewide precipitation, Colorado in the 73rd percentile, and Utah in the 57th percentile.
. For the month, Wyoming ended up in the 77th percentile for statewide precipitation, Colorado in the 73rd percentile, and Utah in the 57th percentile.
The first three weeks of December were very mild across the region, and even with cold waves intruding around the holidays, the month ended up warmer than average across nearly the entire region ![]() . Northern Utah, northwestern Colorado, and southwestern Wyoming saw temperatures 6–10°F warmer than the monthly normal. All three states were above the 80th percentile for monthly statewide average temperature.
. Northern Utah, northwestern Colorado, and southwestern Wyoming saw temperatures 6–10°F warmer than the monthly normal. All three states were above the 80th percentile for monthly statewide average temperature.
The latest US Drought Monitor US Drought Monitor ![]() , based on conditions as of January 6, shows virtually no changes in drought conditions compared since mid-October. The proportion of the region in D2 or worse drought remains: Utah at 13%; Colorado at 12%, and Wyoming at zero.
, based on conditions as of January 6, shows virtually no changes in drought conditions compared since mid-October. The proportion of the region in D2 or worse drought remains: Utah at 13%; Colorado at 12%, and Wyoming at zero.
Current Streamflows
As of January 8, the maps of current streamflows for Colorado ![]() , Utah
, Utah ![]() , and Wyoming
, and Wyoming ![]() show that for the relatively few gages unaffected by winter icing, flows are normal to above normal in Colorado and Wyoming, and mainly normal or below normal in Utah. On January 8, the Colorado River below Glenwood Springs, CO was in the 72nd percentile, 116% of median flow; the Green River near Greendale, UT was in the 50th percentile, 101% of median flow; and the San Juan River near Bluff, UT, was in the 40th percentile, 86% of median flow.
show that for the relatively few gages unaffected by winter icing, flows are normal to above normal in Colorado and Wyoming, and mainly normal or below normal in Utah. On January 8, the Colorado River below Glenwood Springs, CO was in the 72nd percentile, 116% of median flow; the Green River near Greendale, UT was in the 50th percentile, 101% of median flow; and the San Juan River near Bluff, UT, was in the 40th percentile, 86% of median flow.
Current Snowpack
After the relatively wet December, the Current Basin Snowpack map from NRCS ![]() as of January 9 shows improved conditions overall, with above-median SWE in the majority of the region’s basins. The deepest snowpacks relative to normal conditions, with over 110% of median SWE, are in western and northern Wyoming and northern Utah and south-central Utah. Many other basins are near-normal, with 90-100% of median SWE. Basins in southwestern Colorado and southwestern and far eastern Utah did not improve during December and remain below 70% of median SWE.
as of January 9 shows improved conditions overall, with above-median SWE in the majority of the region’s basins. The deepest snowpacks relative to normal conditions, with over 110% of median SWE, are in western and northern Wyoming and northern Utah and south-central Utah. Many other basins are near-normal, with 90-100% of median SWE. Basins in southwestern Colorado and southwestern and far eastern Utah did not improve during December and remain below 70% of median SWE.
Spring-Summer Streamflow Forecasts
The January 1 spring-summer streamflow forecasts of the season were released by NOAA CBRFC and the NRCS in early January, and show mixed prospects for the coming runoff season across the region. The NRCS Westwide Streamflow Forecast Map ![]() shows that most forecast points in northern and central Colorado, and northern and western Wyoming are expected to have near-average (90-109%) or above-average (110-129%) spring and summer runoff. Most forecast points in central Wyoming, southern Colorado, and southern Utah are expected to have below-average (70-89%) to much-below-average (50-69%) spring and summer runoff. In northern Utah, the forecast points are split between near-average (90-109%) and below-average (70-89%) runoff.
shows that most forecast points in northern and central Colorado, and northern and western Wyoming are expected to have near-average (90-109%) or above-average (110-129%) spring and summer runoff. Most forecast points in central Wyoming, southern Colorado, and southern Utah are expected to have below-average (70-89%) to much-below-average (50-69%) spring and summer runoff. In northern Utah, the forecast points are split between near-average (90-109%) and below-average (70-89%) runoff.
IMPORTANT NOTE: While NRCS and NOAA continue to collaborate on streamflow forecasts, the forecast values are no longer being strictly coordinated between NRCS and some of the RFCs, including the CBRFC. For example, the NRCS January 1 forecast for Lake Powell April–July inflows is 6400 KAF, 89% of average. The NOAA CBRFC January 1 forecast for the same point is 6500 KAF, 91% of average.
Seasonal Climate and Drought Forecasts, including ENSO
The monthly Climate Outlook for January ![]() released on December 31 by NOAA CPC shows no tilt for precipitation. The seasonal outlooks released December 18 show a slight wet tilt in the January–March period
released on December 31 by NOAA CPC shows no tilt for precipitation. The seasonal outlooks released December 18 show a slight wet tilt in the January–March period ![]() for much of Colorado and southern Utah. For the February–April period
for much of Colorado and southern Utah. For the February–April period ![]() , the area of wet tilt covers all of Colorado and Utah, with a stronger tilt in the southern portions of those states.
, the area of wet tilt covers all of Colorado and Utah, with a stronger tilt in the southern portions of those states.
The latest CPC Seasonal Drought Outlook ![]() released December 18 projects that the areas of drought conditions (D1 or worse) in southwestern and south-central Colorado and in Utah will persist or intensify through the end of March. No additional areas of drought development in the region are expected.
released December 18 projects that the areas of drought conditions (D1 or worse) in southwestern and south-central Colorado and in Utah will persist or intensify through the end of March. No additional areas of drought development in the region are expected.
As described in the previous briefing, the Experimental PSD Seasonal Precipitation Forecast Guidance ('SWcast') for the January–March period ![]() shows a tilt towards above-average precipitation over most of Colorado and southern Utah. There is a slight dry tilt forecasted for northern Utah. (The statistical 'SWcast' model targets different indicators of climate system behavior than the dynamical model that drives the CPC outlooks.)
shows a tilt towards above-average precipitation over most of Colorado and southern Utah. There is a slight dry tilt forecasted for northern Utah. (The statistical 'SWcast' model targets different indicators of climate system behavior than the dynamical model that drives the CPC outlooks.)
In the tropical Pacific region, the halting progression towards El Niño conditions continues. The Multivariate ENSO Index (MEI) ![]() remained in weak El Niño territory for the December–January. The weekly benchmark Niño 3.4 sea-surface temperature (SST) index in late December is likewise near the threshold for El Niño conditions.
remained in weak El Niño territory for the December–January. The weekly benchmark Niño 3.4 sea-surface temperature (SST) index in late December is likewise near the threshold for El Niño conditions.
A slight majority of individual ENSO model forecasts compiled by IRI in mid-January ![]() still favor El Niño to form and persist through spring 2015. If an El Niño does develop, it is increasingly likely to be a weak event. The forecasts indicate very little chance of a La Niña event developing before spring 2015.
still favor El Niño to form and persist through spring 2015. If an El Niño does develop, it is increasingly likely to be a weak event. The forecasts indicate very little chance of a La Niña event developing before spring 2015.
December 10, 2014
Highlights
-
November brought mixed results for precipitation for the region, with most Colorado and Wyoming mountain areas wetter than average, and nearly all of Utah much drier than average.
-
The snowpack is still lagging behind normal conditions in most of the region's basins, with southwestern Colorado, southern and eastern Utah, and southeastern Wyoming under 70% of median.
-
Most indicators continue to move in the direction of El Niño, with the forecasts indicating that the probability of onset is around 60% through the winter months.
Click on the thumbnail images in the text below to bring up the full-sized graphic
November Precipitation and Temperatures, and Current Drought
For precipitation, November brought a wide range of outcomes for the region ![]() . Nearly all of Utah experienced much-drier-than-average conditions, especially in the southern and western parts of the state. Central Wyoming was dry, while northwestern Wyoming was much wetter than average, as were portions of southern Wyoming. Many of Colorado’s mountain areas ended up above average, but eastern Colorado was very dry.
. Nearly all of Utah experienced much-drier-than-average conditions, especially in the southern and western parts of the state. Central Wyoming was dry, while northwestern Wyoming was much wetter than average, as were portions of southern Wyoming. Many of Colorado’s mountain areas ended up above average, but eastern Colorado was very dry.
November’s monthly mean temperatures were strongly influenced by two Arctic cold waves, with mostly warmer-than-average temperatures south and west of the intrusions in Utah and Colorado, and colder-than-average temperatures elsewhere ![]() . Northern Wyoming saw temperatures 3–9°F colder than the monthly normal. By some measures, the cold wave from the 10th-14th was the most severe on record for November for the Colorado Front Range, but mild temperatures for most of the rest of the month meant that Denver ended up only 2°F below November’s monthly normal.
. Northern Wyoming saw temperatures 3–9°F colder than the monthly normal. By some measures, the cold wave from the 10th-14th was the most severe on record for November for the Colorado Front Range, but mild temperatures for most of the rest of the month meant that Denver ended up only 2°F below November’s monthly normal.
The latest US Drought Monitor US Drought Monitor ![]() , based on conditions as of December 2, shows no change in drought conditions compared to early November, and no change since mid-October. The proportion of the region in D2 or worse drought remains: Utah at 13%; Colorado at 12%, and Wyoming at zero.
, based on conditions as of December 2, shows no change in drought conditions compared to early November, and no change since mid-October. The proportion of the region in D2 or worse drought remains: Utah at 13%; Colorado at 12%, and Wyoming at zero.
Current Streamflows
As of December 9, the maps of current streamflows for Colorado ![]() , Utah
, Utah ![]() , and Wyoming
, and Wyoming ![]() show that flows are normal to above normal in Colorado and Wyoming, and mainly normal or below normal in Utah. Ice is affecting an increasing number of gages, especially in Wyoming, as is typical for this time of year. On December 9, the Colorado River near Cameo, CO was in the 80th percentile, 120% of median flow; the Green River near Greendale, UT was in the 49th percentile, 99% of median flow; and the San Juan River near Bluff, UT, was in the 55th percentile, 105% of median flow.
show that flows are normal to above normal in Colorado and Wyoming, and mainly normal or below normal in Utah. Ice is affecting an increasing number of gages, especially in Wyoming, as is typical for this time of year. On December 9, the Colorado River near Cameo, CO was in the 80th percentile, 120% of median flow; the Green River near Greendale, UT was in the 49th percentile, 99% of median flow; and the San Juan River near Bluff, UT, was in the 55th percentile, 105% of median flow.
Current Snowpack
The Current Basin Snowpack map from NRCS ![]() as of December 10 shows below-median SWE across most of the region’s basins. The several basins with above-median SWE are in western Wyoming, northeastern Wyoming, and northern Utah and south-central Utah. The driest basins, with below 70% of median SWE, are in southwestern Colorado, southern and eastern Utah, and southeastern Wyoming.
as of December 10 shows below-median SWE across most of the region’s basins. The several basins with above-median SWE are in western Wyoming, northeastern Wyoming, and northern Utah and south-central Utah. The driest basins, with below 70% of median SWE, are in southwestern Colorado, southern and eastern Utah, and southeastern Wyoming.
Seasonal Climate and Drought Forecasts, including ENSO
The monthly Climate Outlook for December ![]() released on November 30 by NOAA CPC shows a slight wet tilt for precipitation for the month of December for far southern Colorado and the southern two-thirds of Utah, and a slight dry tilt for far northern Wyoming. The seasonal outlooks released November 20 show a slight wet tilt in December–February period
released on November 30 by NOAA CPC shows a slight wet tilt for precipitation for the month of December for far southern Colorado and the southern two-thirds of Utah, and a slight dry tilt for far northern Wyoming. The seasonal outlooks released November 20 show a slight wet tilt in December–February period ![]() for far southern Colorado and Utah. For the January–March period
for far southern Colorado and Utah. For the January–March period ![]() , the area of wet tilt covers most of Colorado and the southern half of Utah.
, the area of wet tilt covers most of Colorado and the southern half of Utah.
The latest CPC Seasonal Drought Outlook ![]() released November 20 projects that the areas of drought conditions (D1 or worse) in southwestern and south-central Colorado and southern Utah will improve, or be removed, by the end of February. However, the areas of drought in central and northern Utah, and southeastern Colorado, are projected to persist or intensify during that period. No additional areas of drought development in the region are expected.
released November 20 projects that the areas of drought conditions (D1 or worse) in southwestern and south-central Colorado and southern Utah will improve, or be removed, by the end of February. However, the areas of drought in central and northern Utah, and southeastern Colorado, are projected to persist or intensify during that period. No additional areas of drought development in the region are expected.
Compared to the previous briefing, the updated Experimental PSD Seasonal Precipitation Forecast Guidance ('SWcast') for the January–March period shows a more 'bullish' tilt towards above-average precipitation over most of Colorado and southern Utah. There is a slight dry tilt forecasted for northern Utah. (The statistical SWcast model targets different indicators of climate system behavior than the dynamical model that drives the CPC outlooks.)
In the tropical Pacific region, most indicators continue to lurch towards El Niño conditions. The Multivariate ENSO Index (MEI) ![]() for the October–November period popped back up into weak El Niño territory. The weekly benchmark Niño 3.4 sea-surface temperature (SST) index has risen further, to 1.0°C. According to the December 4th ENSO discussion from NOAA CPC, “Although the SST anomalies alone might imply weak El Niño conditions, the patterns of wind and rainfall anomalies generally do not clearly indicate a coupling of the atmosphere to the ocean.”
for the October–November period popped back up into weak El Niño territory. The weekly benchmark Niño 3.4 sea-surface temperature (SST) index has risen further, to 1.0°C. According to the December 4th ENSO discussion from NOAA CPC, “Although the SST anomalies alone might imply weak El Niño conditions, the patterns of wind and rainfall anomalies generally do not clearly indicate a coupling of the atmosphere to the ocean.”
The latest ENSO forecasts still indicate about a good chance that an El Niño event will officially emerge in the next several months. The early-December ENSO Probabilistic Forecast from NOAA CPC and IRI ![]() puts the odds of El Niño onset by February at over 60%, but dropping off to 50% by June 2015. If an El Niño does develop, it is increasingly likely to be a weak event. The forecasts indicate very little chance of a La Niña event developing before spring 2015.
puts the odds of El Niño onset by February at over 60%, but dropping off to 50% by June 2015. If an El Niño does develop, it is increasingly likely to be a weak event. The forecasts indicate very little chance of a La Niña event developing before spring 2015.
November 18, 2014
Highlights
-
October was much drier than average over most of the region. The first half of November has been more mixed for precipitation, with the Colorado and Wyoming mountains faring the best, and much of Utah remaining on the dry side.
-
After a very slow start to the season, the region’s snowpack has improved markedly since November 1, but is still below normal in most basins.
-
An El Niño event is still likely to occur by spring, but the latest forecasts have again backed off slightly on the odds.
Click on the thumbnail images in the text below to bring up the full-sized graphic
October and early November Precipitation and Temperatures, and Current Drought
Water year 2015 began with a whimper: October was very dry over most of the region, with nearly all of Utah, most of Wyoming, and far western and northeastern Colorado receiving less than 50% of average precipitation. Only Colorado had substantial areas with above-average precipitation, mainly in the southeastern quarter. Southern and northwestern Utah saw virtually no precipitation for the month. The first half of November has been a mixed bag for the region. Many areas have seen above-average precipitation for this recent period, especially in the mountains of Colorado and Wyoming. Most of Utah has experienced much-drier-than-average conditions.
Consistent with the low precipitation, October brought above-average temperatures across the entire region, with most locations running 2–6°F warmer than the monthly normals. So far in November, the regional temperature anomalies have been strongly influenced by intrusions of unusually cold Arctic air which began on the 9th, with warmer-than-average temperatures south and west of the intrusions in southern Utah and Colorado, and colder-than-average temperatures elsewhere.
Despite the generally below-average precipitation, the latest US Drought Monitor, based on conditions as of November 11, shows no change in drought conditions compared to mid-October. The proportion of the region in D2 or worse drought remains: Utah at 13%; Colorado at 12%, and Wyoming at zero.
Current Streamflows
As of November 14, the maps of current streamflows for Colorado, Utah, and Wyoming show that flows are normal to above normal in Colorado and Wyoming, and mainly normal or below normal in Utah. Ice is affecting an increasing number of gages, as is typical for this time of year. On November 14, the Colorado River near Cameo, CO was in the 69th percentile, 109% of median flow; the Green River near Greendale, UT was in the 37th percentile, 80% of median flow; and the San Juan River near Bluff, UT, was in the 25th percentile, 81% of median flow.
Current Snowpack
After a very slow start to the snow-accumulation season, conditions have sharply improved since November 1. But even with the most recent storms, the Current Basin Snowpack map from NRCS as of November 17 still shows below-normal (i.e., below-median) SWE across much of the region. Colorado, northwestern Wyoming, and southern Utah have the best conditions. Mid-November is still relatively early in the season, with most of the normal seasonal accumulation yet to come.
Seasonal Climate and Drought Forecasts, including ENSO
The monthly Climate Outlook for November released on October 31 by NOAA CPC shows equal chances (EC) of above-average or below-average precipitation for the month of November. The seasonal outlooks released October 16 were described in the previous briefing. They show mostly equal chances for the region, with a slight wet tilt in November–January period for extreme southern Colorado Utah, and a dry tilt in northwestern Wyoming. For the December–February period, the area of wet tilt is the same, but the area of dry tilt shifts out of Wyoming.
As described in the previous briefing, latest CPC Seasonal Drought Outlook released October 16 projects that the areas of drought conditions (D1 or worse) in Colorado and southern Utah will improve, or be removed, by the end of January. However, the areas of drought in central and northern Utah are projected to persist or intensify during that period. No additional areas of drought development in the region are expected.
The experimental PSD precipitation forecast guidance ('SWcast') for the January–March period shows a tilt towards above-average precipitation over northeastern Colorado and a smaller wet tilt over far southern Utah. There is a slight dry tilt forecasted for northern Utah. (The statistical SWcast model targets different indicators of climate system behavior than the dynamical model that drives the CPC outlooks.)
The second season of experimental SWE forecasts for Colorado from NOAA PSD begins with the January 1 SWE forecast, issued in late October. The median (50th percentile) forecast calls for above-average January 1 snowpack (101–120% of average) for 5 of the 7 major basins in Colorado, and below-average snowpack in the Yampa (94%) and Colorado Headwaters (87%).
In the tropical Pacific, ENSO indicators are giving mixed signals, and the likelihood of a full-blown El Niño event may be declining. The Multivariate ENSO Index (MEI), dropped again September–October period, back into neutral territory. The benchmark Niño 3.4 sea-surface temperature index has finally climbed well above the 0.5°C threshold (currently 0.8°C), though it needs to stay above that for several more months to officially signal an El Niño.
According to the latest ENSO forecasts, it is still more likely than not that an El Niño event will officially emerge in the next several months. The early-November ENSO Probabilistic Forecast from NOAA CPC and IRI puts the odds of El Niño onset at 58%, a drop from the mid-October Forecast (65%). If an El Niño does develop, it is increasingly likely to be a weak event. The forecasts indicate virtually no chance of a La Niña event developing before spring 2015.
October 21, 2014
Highlights
-
Water year 2014 closed with a wetter-than-average September for most of the region, but October has been much drier than average so far, except in southeastern Colorado.
-
At the end of September, nearly all of the region's reservoirs were in better shape than at the same time last year, but most reservoirs in Utah and southern Colorado were still lagging the long-term average.
-
The NOAA CPC monthly and seasonal outlooks show mostly equal chances for above-average or below-average precipitation for late fall and early winter, while the 'SWcast' shows more of a wet tilt for Utah and Colorado.
-
ENSO indicators are more consistently pointing towards El Niño onset, which is likely to officially occur by spring, according to the latest forecasts.
Click on the thumbnail images in the text below to bring up the full-sized graphic
September and early October Precipitation and Temperatures, and Current Drought
Water year 2014 concluded with a wet September for most of the region, with nearly all of Utah and most of Wyoming and Colorado seeing above-average precipitation for the month. Through October 19, water year 2015 has gotten off to a dry start across the region, with the exception of southeastern Colorado.
For the 12 months of water year 2014, most of the region saw above-average precipitation, with nearly all of Wyoming, northern and central Colorado, and eastern, northern, and southeastern Utah ending up on the wet side of the ledger. Southeastern and southwestern Colorado, southeastern Utah, and central Utah were on the dry side. Very few areas saw less than 70% of average water year precipitation. Because the best months for precipitation across Utah were July, August, and September—a time of year that produces less efficient runoff—water-year streamflows were generally lower than would be expected given the water-year precipitation.
Despite the generally above-average precipitation in September, the temperatures were 0-4°F warmer than average over nearly the entire region. Thus far, October has also been running warmer than average.
With the ample precipitation in September, the latest US Drought Monitor, based on conditions as of October 14, shows overall less drought in the region compared to early September. Drought conditions improved in southeastern and southwestern Colorado, southern Wyoming, and multiple areas in Utah. For the first time since June 2012, there are no areas of D3 or D4 drought in the region. The proportion of the region in D2 or worse drought is likewise on the decline: Utah down to 13% from 19%, Colorado down to 12% from 16%, and Wyoming unchanged at zero.
Current Streamflows
As of October 19, the maps of current streamflows for Colorado, Utah, and Wyoming show that flows are normal to much above normal in Colorado and Wyoming, and mainly normal in Utah. On October 17, the Colorado River near Cameo, CO was in the 97th percentile, 150% of median flow; the Green River near Greendale, UT was in the 46th percentile, 94% of median flow; and the San Juan River near Bluff, UT, was in the 34th percentile, 76% of median flow.
Current Reservoir Storage
The majority of Utah's major reservoirs ended the 2014 water year with less storage than the long-term average for the end of September. In Colorado, most of the major reservoirs had more storage than the long-term average for the end of September, while in Wyoming, nearly all major reservoirs had more storage than the long-term average.
As of October 19, Lake Powell held 12.34 MAF (51% full).
Current Snowpack
Across the region, October's mostly dry, sunny weather has not helped to build on or retain the initial snows left mainly by storms in September. The Current Basin Snowpack map from NRCSindicates below-normal (i.e., below-median) SWE across nearly all of the region. We are still very early in the snowpack season, and the % of normal SWE values are much more volatile than later in the season. This is demonstrated nicely by the very high % of normal values in several Utah basins; this is due mainly to the median SWE being zero for this time of year at most sites in these basins, and no site in Utah currently has more than 0.6" of SWE. The forecasted precipitation over the next several days does not look like it will add much to the snowpack, but the increased cloudiness may at least stem the losses.
Seasonal Climate and Drought Forecasts, including ENSO
The monthly Climate Outlook for October released on September 30 by NOAA CPC shows equal chances (EC) of above-average or below-average precipitation for the month. The seasonal outlooks released October 16 show mostly equal chances for the region, with a slight wet tilt in November–January period for extreme southern Colorado Utah, and a dry tilt in northwestern Wyoming. For the December–February period, the area of wet tilt is the same, but the area of dry tilt shifts out of Wyoming.
The latest CPC Seasonal Drought Outlook released October 16 projects that the areas of drought conditions (D1 or worse) in Colorado and southern Utah will improve, or be removed, by the end of January. However, the areas of drought in central and northern Utah are projected to persist or intensify during that period. No additional areas of drought development in the region are expected.
The experimental PSD precipitation forecast guidance ('SWcast'), released September 15 for the October–December period shows a slight tilt towards above-average precipitation over southern and eastern Utah and southeastern Colorado. (The statistical SWcast model targets different indicators of climate system behavior than the dynamical model that drives the CPC outlooks.)
In the tropical Pacific, ENSO indicators are slowly converging on El Niño status. The Multivariate ENSO Index (MEI), which has actually been signaling El Niño conditions since April, dropped sharply in August–September, but is expected to rebound in the coming month. Indicators based only on sea-surface temperatures, such as Niño 3.4, have generally moved towards the warm edge of neutral territory. The climate system has already exhibited some of the typical "side effects" of El Niño in the last several months, including a weak Indian Monsoon, a suppressed North Atlantic hurricane season, and drought in Central America.
According to the latest ENSO forecasts, it is likely that an El Niño event will officially emerge in the next several months. In the IRI ENSO Prediction Plume from mid-October, about 65% of the models call for El Niño onset in the late fall period (October–December), with that proportion remaining steady through the February–April period before declining. The forecasts indicate virtually no chance of a La Niña event developing before spring 2015.
September 8, 2014
Highlights
-
After mixed outcomes for precipitation in July, the summer ended on a wet note in August, with much of the region receiving over 200% of average precipitation for the month.
-
The vast majority of reservoirs across the region now have more storage than at the end of August last year. Reservoirs in Colorado and Wyoming are also ahead of the long-term average, while most reservoirs in Utah are below the long-term average.
-
The NOAA CPC monthly and seasonal outlooks are tilted towards wetter-than-average conditions for our region for the fall months.
-
While official ENSO indicators remain in neutral territory, an El Niño event is still expected to emerge this fall or winter.
Click on the thumbnail images in the text below to bring up the full-sized graphic
July and August Precipitation and Temperatures, and Current Drought
After a very mixed precipitation picture in July, the summer of 2014 finished on an overall wet note in August. July was drier than average across Wyoming except for the southeastern and far southwestern parts of the state. An active start to the summer monsoon season saw wet anomalies for July in most of eastern Colorado and portions of Utah, but some areas in both states saw below-average precipitation. In August, the monsoonal activity favored western Colorado and southern Utah, while a very potent Pacific storm tracked across the northern part of the region towards the end of the month. Only south-central Colorado ended the month with below-average precipitation, while much of the region saw over 200% of the average precipitation for August.
For July, temperatures were 0-4°F warmer than average over most of the region, while the wetter conditions in August led to nearly all of the region at 0-4°F cooler than average for the month.
The latest US Drought Monitor, based on conditions as of September 2, shows slightly less drought across the region compared to early July. Drought conditions improved in northern Utah and in eastern Colorado, but worsened in parts of southern and central Utah. The proportion of the region in D2 or worse drought: Utah down to 19% from 22%, Colorado slightly down to 16% from 17%, and Wyoming unchanged at zero.
Current Streamflows
As of September 7, the maps of current streamflows for Colorado, Utah, and Wyoming show that flows are generally normal to much above normal in Colorado and Wyoming, except in far southern Colorado, and mainly normal or below normal or in Utah. On September 7, the Colorado River near Cameo, CO was in the 89th percentile, 133% of median flow; the Green River near Greendale, UT was in the 69th percentile, 127% of median flow; and the San Juan River near Bluff, UT, was in the 33rd percentile, 67% of median flow.
Reservoir Storage
In Utah, even after a drier-than-average runoff season, most of the major reservoirs tracked by NRCS had more storage at the end of August than on the same date last year, though more than half had less than the long-term average for the end of August. In Wyoming and Colorado, where runoff was above-average, nearly all major reservoirs had both more storage than last year and more than the long-term average for the end of August.
As of September 4, Lake Powell held 12.31 MAF (51% full), up by more than 1.5 MAF from storage on the same date last year (10.79 MAF; 44% full).
Seasonal Climate and Drought Forecasts, including ENSO
The monthly Climate Outlook for September released on August 31 by NOAA CPC shows a slight wet tilt for precipitation for all of Colorado, the southern half of Utah, and far southeastern Wyoming. The seasonal outlooks released August 21 also show a wet tilt in precipitation for most of the region for the September–November period, with the strongest tilt in Colorado and southern Utah. For the October–December period, the area of wet tilt moves south, so that only the far southern portions of both Utah and Colorado show a slight wet tilt. The relatively wet CPC outlooks reflect the expectation that an El Nino will develop.
The latest CPC Seasonal Drought Outlook released August 21 projects that the areas of drought conditions (D1 or worse) in Colorado and southern Utah will improve, or be removed, by the end of November. However, the areas of drought in central and northern Utah, and south-central Wyoming, are projected to persist or intensify during that period. No additional areas of drought development in the region are expected.
The experimental PSD precipitation forecast guidance ('SWcast'), released July 16 for the July–September period has a drier outlook than the CPC forecasts over the past few months, calling for a dry tilt over most of Utah and Colorado, with the strongest dry tilt in eastern Colorado. The difference from the CPC outlooks stems from the statistical SWcast model targeting different indicators of climate system behavior than the dynamical model that is driving the CPC outlooks.
Since early July, ENSO indicators have generally moved away from signaling impending El Niño conditions, though there has been some rebound in the past few weeks. The Multivariate ENSO Index (MEI) dropped slightly in the June–July time frame and then came back up in July–August to nearly the level of May–June, remaining in El Niño territory. The Oceanic Niño Index (ONI), used by NOAA for determining official ENSO status and based on the adjusted 3-month Niño 3.4 sea-surface temperature anomaly, is at +0.1°C, well short of the +0.5°C threshold. ENSO forecasts are still calling for an El Niño event to emerge in the next several months, though with less certainty than three months ago. In the IRI ENSO Prediction Plume from mid-August, about 55% of the models call for El Niño onset by the fall period (September–November), rising to over 70% for the December–February period. If and when the El Niño does develop, the forecasts indicate that it is more likely to be a weak or moderate event than a strong event. The forecasts indicate virtually no chance of a La Niña event developing before spring 2015.
July 11, 2014
Highlights
-
June was much drier than average across most of the region, with southern Utah and far southwestern Colorado seeing the driest conditions.
-
With the above-average spring-summer runoff in Wyoming and most of Colorado, reservoir storage there has strongly rebounded. Utah and southwestern Colorado saw below-average runoff, and reservoir storage continues to lag compared to average conditions.
-
The NOAA CPC monthly and seasonal outlooks are tilted towards wetter-than-average conditions for our region for the summer and early fall. The PSD 'SWcast' is less optimistic about the monsoon season than the CPC outlooks, showing a dry tilt for most of Utah and Colorado.
-
In the past month, the progression of atmospheric and oceanic conditions towards El Niño status has slowed, but an El Niño event is still expected to emerge by fall.
Click on the thumbnail images in the text below to bring up the full-sized graphic
June Precipitation and Temperatures, and Current Drought
June was much drier than average across most of the region. Western Colorado, south-central Wyoming, and all of Utah except for the Wasatch region received less than 50% of average precipitation, with southern Utah and far southwestern Colorado seeing virtually no precipitation. Only northern Wyoming, southwestern Wyoming, and northeastern Colorado were wetter than average for the month.
Even in the driest parts of the region, June temperatures remained close to average, with most of Utah and southern Colorado 0-2°F warmer than the monthly average, and Wyoming and northern Colorado 0-4°F to cooler than average.
The latest US Drought Monitor shows slightly more drought across the region compared to early June. Drought conditions improved further in eastern Colorado but worsened in south-central Colorado. Abnormally dry conditions emerged in southwestern Wyoming. The proportion of the region in D2 or worse drought: Utah unchanged at 22%, Colorado unchanged at 17%, and Wyoming unchanged at zero.
Spring-Summer Runoff and Current Streamflows
With the meltout of snowpacks nearly complete, streamflows across the region are quickly declining from their seasonal peaks. No further snowmelt flooding has occurred since early June. As of July 9, the maps of current streamflows for Colorado, Utah, and Wyoming show that flows are generally normal to much above normal in Colorado and Wyoming, and mainly below normal or normal in Utah. On July 9, Colorado River near Cameo, CO was in the 70th percentile, 139% of median flow; the Green River near Greendale, UT was in the 56th percentile, 105% of median flow; and the San Juan River near Bluff, UT, was only in the 25th percentile, 44% of median flow.
Reservoir Storage
With the above-average runoff in Wyoming and most of Colorado, storage has rebounded in most of the region’s reservoirs after dry years in 2012 and 2013. At the end of June, nearly all major reservoirs in Colorado tracked by NRCS had more storage than at this time last year, and a majority were above the long-term average, especially in the Upper Colorado and South Platte basins. In Wyoming, nearly all major reservoirs had both more storage than last year and more than the long-term average for end of June. In Utah, however, with a drier-than-average runoff season only about half of the major reservoirs had more storage than last year, and less than one-quarter had more than the long-term average for end of June.
As of July 9, Lake Powell held 12.70 MAF (52% full), up by more than 1 MAF from storage on the same date last year (11.60 MAF; 47% full). Powell storage now appears to be close to its annual peak for 2014.
Seasonal Climate and Drought Forecasts, including ENSO
The monthly Climate Outlook for July released on June 30 by NOAA CPC shows a wet tilt for precipitation for nearly all of Utah, Wyoming, and Colorado, with the strongest tilt in eastern Utah, western Colorado, and southern Wyoming. The seasonal outlooks released June 19 also show a wet tilt in precipitation for our entire region for the July–September and August–October periods, with the strongest tilt in eastern Utah, western Colorado, and southern Wyoming in the earlier period, and in the southern two-thirds of Utah and nearly all of Colorado for the later period. The relatively wet CPC outlooks reflect the expectation of an active monsoon season.
The latest CPC Seasonal Drought Outlook released June 19 projects that the areas of drought conditions (D1 or worse) across Colorado and Utah will improve or be removed by the end of September. No additional areas of drought development in the region are expected.
The experimental PSD precipitation forecast guidance ('SWcast'), released June 17 for the July–September period has a much drier outlook than the CPC forecasts, calling for a dry tilt over most of Utah and Colorado, with the strongest dry tilt in eastern Colorado. The difference from the CPC outlooks stems from the statistical SWcast model keying off different indicators of climate system behavior than the dynamical model that is driving the CPC outlooks.
Over the last month, the ramp-up of atmospheric and oceanic conditions towards an El Niño event has slowed somewhat, but the forecasts are still calling for an event to emerge in the next several months. The Multivariate ENSO Index (MEI) dropped slightly in the May-June time frame compared to April–May, but is still in El Niño territory. In the IRI ENSO Prediction Plume from mid-June, about 80% of the models are calling for El Niño onset by the fall period (September–November). If the El Niño develops, the forecasts indicate that it is more likely to be a weak or moderate event than a strong event.
June 13, 2014
Highlights
-
May was wetter than average across most of Colorado, adding to the above-average snowpacks in many basins. Drier than average conditions were experienced in most of Wyoming and northern Utah.
-
The spring runoff, in line with previous forecasts, has been above average to much above average in nearly all of Wyoming, and in northern, central, and southeastern Colorado. Below to much-below-average runoff has been observed in southwestern and south-central Colorado, southwestern Utah, and most of the eastern Great Basin.
-
Many gages in Colorado and Wyoming have seen record-high or near-record-high daily flows in the past three weeks, with minor to moderate flooding in some areas.
-
With the above-average spring runoff in the northern two-thirds of the region, reservoirs are regaining storage depleted by the last two years of dry conditions.
-
Atmospheric and oceanic conditions are still pointing to the very likely emergence of an El Niño event by fall. Sea-surface temperatures have continued to warm in the equatorial Pacific.
Click on the thumbnail images in the text below to bring up the full-sized graphic
May Precipitation and Temperatures, and Current Drought
May was wetter than average across Colorado (except the southeastern quarter), southern Utah, and far southeastern Wyoming. The month was drier than average in northern Utah and nearly all of Wyoming, though only relatively small areas saw less than 50% of average precipitation.
May temperatures were up 3°F to cooler than average in most of Colorado, eastern Utah, and eastern Wyoming, and up to 4°F warmer than the monthly average, in the remainder of Wyoming and Utah.
The latest US Drought Monitor, representing conditions as of June 10, shows slightly less drought for the region compared to early May. Drought conditions improved in eastern and southwestern Colorado, while worsening in a smaller area of south-central Colorado. The proportion of the region in D2 or worse drought: Utah unchanged at 22%, Colorado at 17%, down from 19%, and Wyoming unchanged at zero.
Current Snowpack
Early June is typically well past the peak accumulation at even the highest-elevation SNOTEL sites, and many sites have normally melted out by this date. Thus, the numerical percent-of-median-SWE values on the Current Basin Snowpack Map should be treated with caution. That said, the prevalence of dark blue colors (>150% of median) on the map in Colorado, Wyoming, and far northern Utah does indicate an unusually large and persistent late-season snowpack in those basins. The basins in southwestern Colorado and southern Utah that were lagging behind seasonal normals throughout the spring have completely melted out and are not shown on the map.
According to the Colorado Dust-on-Snow Program (CODOS), no more dust events have occurred since May 13, leaving the seasonal total at eight events. The latest CODOS update noted that consolidated dust layers from events D3–D8 were exposed at the snow surface during field surveys done from June 2–4 at CODOS sites at Grand Mesa, Hoosier Pass, Loveland Pass (Grizzly Peak), Berthoud Pass, Willow Creek Pass, Rabbit Ears Pass, and McClure Pass, as well as Independence Pass. With the exposed dust, snow-surface albedo (reflectivity) is unusually low, and melt rates will be above-average through the remainder of the season, leading to a steeper-than-average declining limb of the annual hydrograph.
Spring Runoff and Current Streamflows
Overall, observed runoff in April and May has been consistent with the May 1 water supply forecasts made by the NOAA Colorado Basin River Forecast Center and by the NRCS. Runoff has been above-average to much-above average in most of Wyoming, and northern and central Colorado. Below to much-below-average runoff has been observed in southwestern and south-central Colorado, southwestern Utah, and most of the eastern Great Basin.
As is typical for early June, mountain snowpacks have been melting rapidly, and rivers in the basins that accumulated above-normal snowpacks have produced high daily flows. Many gages in northern and central Colorado saw record-high or near-record daily flows in late May or early June. The Colorado River near Dotsero peaked slightly above flood stage, while on the other side of the Continental Divide, the Cache la Poudre River peaked well above flood stage west of Fort Collins and in Greeley, causing damage to several dozen homes and businesses. Flows at these gages, and elsewhere in northern and central Colorado, are now probably past the seasonal peak but remain much above normal. Most parts of the Front Range impacted by flooding last September have been spared further flooding so far.
As of June 12, the maps of current streamflows for Colorado, Utah, and Wyoming show that flows are normal to much above normal in Colorado and Wyoming, and mainly below normal or normal in Utah.
Reservoir Storage
After two years of below-average runoff depleted the region’s water storage, this spring's runoff thus far has helped most of the region's reservoirs regain lost ground. At the end of May, nearly all reservoirs in Colorado and Wyoming had more storage than last year, while Utah's reservoirs are more split between gains and losses compared to last year. As of June 11, Lake Powell held 11.76 MAF (48% full), down very slightly from 11.79 MAF (48% full) on the same date last year. However, last year at this time Powell's storage had nearly peaked for the season, while now Powell is still gaining about 80,000 AF per day, and should continue to gain storage through June.
Spring–Summer Streamflow Forecasts
The June 1 forecasts issued by NCRS and NOAA CBRFC for spring–summer streamflow across the region are generally similar to the May 1 forecasts, except in the Colorado Headwaters, Yampa-White, and South Platte basins in Colorado, where above-average May precipitation led to considerable increases in the runoff forecasted for June and July. Note that NRCS does not update their Westwide Streamflow Forecast Map, shown above in the Dashboard, past May 1.
IMPORTANT NOTE: While NRCS and NOAA continue to collaborate on streamflow forecasts, the forecast values are no longer being strictly coordinated between NRCS and some of the RFCs, including the CBRFC. The NRCS June 1 forecast for Lake Powell April–July inflows is 7300 KAF, 102% of average, up from 7160 KAF in the May 1 forecast. The NOAA CBRFC June 1 forecast for Lake Powell inflows is 7550 KAF, 105% of average, which is unchanged from the May 1 forecast.
Seasonal Climate and Drought Forecasts, including ENSO
The monthly Climate Outlook for June released on May 31 by NOAA CPC shows a wet tilt for precipitation for nearly all of Wyoming, and northern and eastern Colorado, with the strongest tilt in far eastern Wyoming. The seasonal outlooks released May 15 show a wet tilt in precipitation for our entire region for the June–August and July–September periods, with the strongest tilt in eastern Utah, western Colorado, and southwestern Wyoming.
The latest CPC Seasonal Drought Outlook released May 15 projects that the areas of drought conditions (D1 or worse) in Colorado and southeastern Utah will improve or be removed by the end of August, while drought areas in western Utah will persist through that time frame. No additional areas of drought development are expected.
As reported in the previous briefing, according to the experimental PSD precipitation forecast guidance ('SWcast'), for the April–June period there is a dry tilt for southern Utah, extending into northwestern Colorado, and a slight wet tilt for southwestern Colorado. For the July–September period there is a dry tilt for all of Utah, and northern and eastern Colorado. Note that forecast skill is relatively poor for the latter period and lead time.
Atmospheric and oceanic conditions continue to indicate that an El Niño event is emerging. The Multivariate ENSO Index (MEI) experienced its 2nd largest increase ever for the April–May timeframe, moving sharply into El Niño territory. In the IRI ENSO Prediction Plume from mid-May, nearly all of the models call for continued near-term warming in the Niño 3.4 region. By the late-summer period (July–August), a little under two-thirds of the models are calling for El Niño onset, reaching over 70% by fall. The consensus of the forecasters is that El Niño onset is even more lilkely than indicated by the models. Assuming the El Niño develops, it is still very uncertain how strong it may become.
May 13, 2014
Highlights
-
April was generally drier than average across the region, with few mountain areas seeing above-average precipitation, in contrast with previous months. The second week of May brought heavy precipitation to many parts of the region.
-
As of May 13, snowpack conditions are similar to one month ago, with near-normal to above-normal SWE in Wyoming, northern and central Colorado, and northern Utah, and below-normal SWE in central and southern Utah and southern Colorado.
-
The May 1 spring-summer streamflow forecasts slipped a little from the April 1 forecasts, though still calling for most forecast points in Wyoming and northern and central Colorado to have above-average or much-above-average spring runoff. Most forecast points in south-central and southwestern Colorado, and in Utah south of the Wasatch Front, are expected to have below-average or much-below-average runoff.
-
Watersheds in the northern Front Range of Colorado most affected by the floods last September still have well-above-normal SWE. There is an elevated potential for snowmelt flooding given the large snowpacks and sediment-impacted stream channels.
-
The emergence of an El Niño event in the next several months looks increasingly likely, with atmospheric and oceanic conditions consistently moving in that direction.
Click on the thumbnail images in the text below to bring up the full-sized graphic
April Precipitation and Temperatures, and Current Drought
After a wet late winter and early spring for the region’s mountains, April brought below-average precipitation to most mountain areas, with the exception of northwestern Wyoming. Utah was on the dry side except for the far northern and the far eastern portions of the state. In Colorado, there were wet pockets in the south-central and northeast, with the rest of the state seeing below-average to average precipitation. Wyoming was mostly drier than average, especially the southwestern quarter of the state. The second week of May brought a couple of potent systems that dropped 0.5"–3” of precipitation across the region, providing a big boost to the snowpack, with north-central Colorado and southeast Wyoming seeing the highest totals.
April temperatures were close to normal across the region, with few areas more than 2°F above or below the monthly average.
The latest US Drought Monitor, representing conditions as of May 6, shows a net increase in drought severity in our region since early April. Drought conditions worsened in southeastern Utah and adjacent southwestern Colorado, and in eastern Colorado. Improvement was seen in southeastern Wyoming. The proportion of the region in D2 or worse drought increased again, with Utah up to 22% from 16%, Colorado up to 19% from 15%, and Wyoming unchanged at zero.
Current Snowpack
May 13 is past the typical peak snow accumulation date for all basins in our region and all but the highest-elevation and northernmost sites. The percent-of -median-SWE values may be misleading in those basins that are well down the declining limb of their seasonal snowpack trajectory, such as in southern Utah.
A generally dry April was balanced out by a wet early May in most mountain areas, so the Current Basin Snowpack map from NRCS shows that conditions as of May 13 are similar to where they were one month ago. Wyoming and northern Colorado continue to have above-normal to much-above-normal SWE, with nearly all basins at 130% of median SWE or greater. Northern Utah basins are near or above normal, while the remainder of the state is below-normal and headed to early meltout, albeit delayed by the most recent storms. In Colorado, the San Juan-San Miguel-Dolores (75% of median SWE) and Rio Grande (56% of median SWE) basins are lagging well behind the rest of the state.
According to the Colorado Dust-on-Snow Program, three dust-on-snow events affected at least southwestern Colorado in late April and early May, bringing the seasonal total to eight, one more than the average number of seasonal events since 2005. Consolidation and surface exposure of the previous dust layers from the larger events D3, D4, and D5 led to earlier and faster snowmelt throughout April in many parts of the Colorado mountains, especially in the San Juans. While these dust layers have now been reburied by the most recent snows, they will re-emerge in coming days to weeks and continue to hasten snowmelt and runoff.
Current Streamflows
The maps of current streamflows for Colorado, Utah, and Wyoming show that flows are near normal to above normal in Colorado and Wyoming, with several gages in Wyoming reporting daily record high flows. Flows are mainly normal to much below normal in Utah, with a few gages recording record daily low flows.
Spring-Summer Streamflow Forecasts
The Westwide Streamflow Forecast Map based on the NRCS May 1 forecasts shows small decreases from the April 1 forecasts in several basins, including southeastern and central Wyoming and central Utah. Most forecast points in Wyoming and northern and central Colorado are expected to have near-average (90-109%), above-average (110–129%) or much-above-average (130–149%) spring and summer runoff. Most forecast points in south-central and southwestern Colorado, and most forecast points across Utah, are expected to have below-average (70–89%) to much-below-average (50-69%) spring and summer runoff, with an increasing number of points expected to have far-below-average (25–49%) runoff, and four southern Utah points in the under-25% category. Most points in northern Utah and west-central Colorado are expected to have below-average (70-89%) to near-average (90–109%) runoff.
In the watersheds in the northern Front Range of Colorado (St. Vrain/Boulder, Big Thompson, upper Cache la Poudre) that were most affected by the floods last September, SNOTEL sites are still showing much-above-normal (>130% of median) SWE. The NRCS May 1 forecasts for these basins slipped slightly, to 107–122% of average spring–summer runoff, though these forecasts were made prior to the snow accumulation from the major storm on May 10–13. According to NOAA NWS, there is still a high potential for snowmelt flooding in these basins. Since stream channels are impacted by debris and excess sediment in many locations in these basins, the risk and severity of flooding may be greater than in previous high-runoff years.
IMPORTANT NOTE: While NRCS and NOAA continue to collaborate on streamflow forecasts, the forecast values are no longer being strictly coordinated between NRCS and some of the RFCs, including the CBRFC. The NRCS May 1 forecast for Lake Powell April–July inflows is 7160 KAF, 100% of average. The NOAA CBRFC May 1 forecast for Lake Powell inflows is 7550 KAF, which is 105% of average.
Seasonal Climate and Drought Forecasts
The monthly Climate Outlook for April released on April 30th by NOAA CPC shows a wet tilt for precipitation for nearly all of Wyoming, and far northeastern Colorado, with the strongest tilt in northern Wyoming. The seasonal outlooks released April 17 show a wet tilt in precipitation for most of Utah and Colorado for May–July and June–August periods, with the strongest tilt in eastern Utah and western Colorado. The latest CPC Seasonal Drought Outlook released April 17 projects that the areas of drought conditions (D1 or worse) in Utah and Colorado will persist through at least July, but no additional areas of drought development are expected.
According to the experimental PSD precipitation forecast guidance ('SWcast'), for the April–June period there is a dry tilt for southern Utah, extending into northwestern Colorado, and a slight wet tilt for southwestern Colorado. For the July–September period there is a dry tilt for all of Utah and northern and eastern Colorado. Note that forecast skill is relatively poor for the latter period and lead time.
The prospect of an El Niño event emerging in the next several months looks increasingly likely, with atmospheric and oceanic conditions indicating a continued progression towards El Niño. In the IRI ENSO Prediction Plume from mid-April, all of the models call for near-term warming in the Niño 3.4 region, and by the mid-summer period (June–August), two-thirds of the models are calling for El Niño onset, exceeding 75% by the September–November period. The experimental PSD ENSO forecast has a >80% chance of El Niño development by mid-summer. Assuming the El Niño develops, there is still great uncertainty as to how strong it may become.
April 9, 2014
Highlight
-
March's storm tracks and the resulting precipitation once again favored the mountains in Wyoming and northern and central Colorado. Southern Utah and southwestern and eastern Colorado ended the month drier than average.
-
As of April 8, snowpack conditions have changed little from a month ago, with near-normal to above-normal SWE over most of the region. Nearly all basins across Wyoming, and all basins in northern Colorado and far-northern Utah, are at over 120% of median SWE. Basins in southern and central Utah, and south-central and southwestern Colorado are at 90% of median SWE or less.
-
The April 1 spring-summer streamflow forecasts have likewise changed little from the March 1 forecasts, calling for most forecast points in Wyoming and northern and central Colorado to have above-average or much-above-average spring runoff. Most forecast points in south-central and southwestern Colorado, and in Utah south of the Wasatch Front, are expected to have below-average or much-below-average runoff.
-
Watersheds in the northern Front Range of Colorado that were most affected by the floods last September have well-above-normal snowpacks, and with stream channels impacted by debris and sediment, there is a high potential for snowmelt flooding.
-
In early March, NOAA CPC hoisted an El Niño Watch, indicating that “conditions are favorable for the development of El Niño conditions within the next six months.” Since then, sea-surface temperatures in the bellwether Niño 3.4 region have rapidly warmed, consistent with El Niño development.
Click on the thumbnail images in the text below to bring up the full-sized graphic
March Precipitation and Temperatures, and Current Drought
As during much of this winter, the storm tracks and dynamics in March favored the northern portions of our region, especially the mountains. Areas with above-average to much-above-average precipitation for the month included most of Wyoming, northwestern and north-central Colorado, far northern Utah, and small areas of southern Utah and southern Colorado. The remainder of southern Utah, southwestern Colorado, and eastern Colorado were much drier than average. The first week of April saw systems that brought above-average precipitation to most of Colorado, northern and central Utah, and western Wyoming.
The pattern in temperature anomalies across the region in March reflected the continued incursions of cold air masses into the north-central and midwestern US, with northern Wyoming and central and east-central Colorado ending the month colder than average by 0–6°F. Outside of the influence of these cold waves, Utah, southern Wyoming, and the rest of Colorado were 0–6°F warmer than average.
The latest US Drought Monitor, representing conditions as of April 1, shows a net increase in drought severity in our region since early March. Improvement was seen in south-central and southeastern Wyoming (from D0 to drought-free). But drought conditions worsened in southwestern Utah (D0 to D1, and D1 to D2), southeastern Utah and adjacent southwestern Colorado (D0 to D1), and southeastern Colorado (D2 to D3). The proportion of the region in D2 or worse drought increased slightly, with Utah bumped up to 16% from 11%, Colorado nudged up to 15% from 14%, and Wyoming unchanged at zero.
Current Snowpack
The Current Basin Snowpack map from NRCS shows little change since early March, with most of the region having near- to much-above-normal SWE as of April 8. Wyoming, northern Colorado, and far northern Utah are at 120% of median SWE or greater, with over 140% of median SWE in western, north-central, and southeastern Wyoming, and northeastern Colorado. Conditions in central and south-central Utah have improved slightly since March 1, with SWE now at 70–105% of median. Southwestern and southeastern Utah basins have continued to see dry conditions, and have experienced early snowmelt, and snowpacks are well below normal at 50–55% of median. Southwestern and south-central Colorado are also lagging behind the basins to the north, at around 85% of median. Early April typically represents the peak snowpack accumulation in many basins.
According to the Colorado Dust-on-Snow Program, there were four dust-on-snow events that affected at least southwestern Colorado in February and March, and a fifth on April 1. Two of the five WY2014 events, both in late March (D3 and D4), deposited substantial amounts of dust. Both events extended to central and northern Colorado, though only D4 left a prominent dust layer in those areas. Since 2005, the number of seasonal dust-on-snow events by April 1 has ranged from one to seven, with an average of four events. The month of April has the highest occurrence of dust events, with an average of three events since 2005.
Current Streamflows
The maps of current streamflows for Colorado, Utah, and Wyoming show that the majority of gages are now free of ice and reporting. Flows are mainly near normal or above normal in Wyoming and Colorado, while they are mainly normal to below normal in Utah.
Spring-Summer Streamflow Forecasts
The Westwide Streamflow Forecast Map based on the NRCS April 1 forecasts shows little change from March 1st, with most forecast points in Wyoming and northern and central Colorado expected to have above-average (110–129%) or much-above-average (130–149%) spring and summer runoff. Most forecast points in south-central and southwestern Colorado, and most forecast points across Utah, are expected to have below-average (70–89%) to much-below-average (50-69%) spring and summer runoff, with a handful of points expected to have far-below-average (25–49%) runoff, and three southern Utah points in the under-25% category. Many points in northern Utah and west-central Colorado are expected to have near-average (90–109%) runoff.
The watersheds in the northern Front Range of Colorado (St. Vrain/Boulder, Big Thompson, upper Cache la Poudre) that were most affected by the floods last September have unusually large snowpacks for early April, at around 150% of median SWE. The NRCS April 1 forecasts for these basins call for 125–130% of average spring–summer runoff. According to NOAA NWS, there is a high potential for snowmelt flooding in these basins. Since stream channels are impacted by debris and excess sediment in many locations in these basins, the risk and severity of flooding may be greater than in previous high-runoff years. Multiple state and federal agencies are cooperating to remove debris and sediment from these channels in preparation for high runoff.
IMPORTANT NOTE: While NRCS and NOAA continue to collaborate on streamflow forecasts, the forecast values are no longer being strictly coordinated between NRCS and some of the RFCs, including the CBRFC. The NRCS April 1 forecast for Lake Powell April–July inflows is 7900 KAF, 110% of average. The NOAA CBRFC April 1 forecast for Lake Powell inflows is 7850 KAF, which is also 110% of average.
Seasonal Climate and Drought Forecasts
The latest monthly Climate Outlook released on March 31st by NOAA CPC shows a dry tilt for precipitation for far southwestern Utah for April. The seasonal outlooks released March 20 show no tilt in precipitation, and so equal chances for wet or dry conditions, for our region for the April–June and May–July periods. The latest CPC Seasonal Drought Outlook released March 20 projects that the areas of drought conditions (D1 or worse) in Utah and southern Colorado will persist through at least June, but no additional areas of drought development are expected.
ENSO indicators such as the Niño 3.4 anomaly that are updated daily (not shown on the Dashboard) have been rapidly shifting from cool-side-of-neutral conditions into warmer territory since mid-March. This was anticipated by the consensus of the IRI ENSO Prediction Plume ![]() for mid-March, in which nearly all of the models called for near-term warming in the Niño 3.4 region. By the mid-summer period (June–August), over half of the models forecast El Niño onset, reaching 60% by the September–November period. Last month, NOAA CPC hoisted an El Niño Watch, indicating that “conditions are favorable for the development of El Niño conditions within the next six months.” An experimental PSD regression-based MEI forecast issued March 10 projects a still higher likelihood of El Niño development, at 64% probability for the July–September period. Based on the intensity of recent tropical wind forcing, subsurface ocean heat anomalies, and historical comparisons, the likelihood of a substantial El Niño event in 2014 has greatly increased over the last two months.
for mid-March, in which nearly all of the models called for near-term warming in the Niño 3.4 region. By the mid-summer period (June–August), over half of the models forecast El Niño onset, reaching 60% by the September–November period. Last month, NOAA CPC hoisted an El Niño Watch, indicating that “conditions are favorable for the development of El Niño conditions within the next six months.” An experimental PSD regression-based MEI forecast issued March 10 projects a still higher likelihood of El Niño development, at 64% probability for the July–September period. Based on the intensity of recent tropical wind forcing, subsurface ocean heat anomalies, and historical comparisons, the likelihood of a substantial El Niño event in 2014 has greatly increased over the last two months.
March 14, 2014
Highlight
-
February storm tracks favored the region’s mountains, especially in Wyoming and northern and central Colorado. Southern Utah and southern Colorado, and most lower-elevation areas, ended up drier than average. A similar pattern has continued into early March.
-
As of March 13, snowpack conditions are near or above average over most of the region. Nearly all basins across Wyoming, and basins in northern Colorado, are at over 120% of median SWE. The basins below 90% of median SWE are in southern and central Utah, and south-central Colorado.
-
The March 1 spring-summer streamflow forecasts call for most forecast points in Wyoming and northern and central Colorado to have above-average or much-above-average spring runoff. Most forecast points in south-central and southwestern Colorado, and in Utah south of the Wasatch Front, are expected to have below-average or much-below-average runoff.
-
The watersheds in the northern Front Range of Colorado that were most affected by the floods last September have unusually large snowpacks, and there is a high risk of snowmelt flooding. With stream channels impacted by debris and excess sediment in many locations, the severity of flooding may be greater than in previous high-runoff years.
Click on the thumbnail images in the text below to bring up the full-sized graphic
February Precipitation and Temperatures, and Current Drought
As in January, precipitation in February was unevenly distributed across our region, with the storm tracks and dynamics generally favoring the high mountains as well as some adjacent areas to the east of the mountains. Areas with above-average to much-above-average precipitation included western and north-central Wyoming, southeastern Wyoming and portions of eastern Colorado, and the high mountains in Colorado and northern and central Utah ![]() . Central and south-central Wyoming, most of the lower-elevation areas of Colorado, and southern and northeastern Utah were drier than average. Overall, an active and consistent weather pattern persisted through the month and into early March, with repeated shots of Pacific moisture in the same locations with each passing low-pressure trough.
. Central and south-central Wyoming, most of the lower-elevation areas of Colorado, and southern and northeastern Utah were drier than average. Overall, an active and consistent weather pattern persisted through the month and into early March, with repeated shots of Pacific moisture in the same locations with each passing low-pressure trough.
There was a striking pattern in temperature anomalies across the region in February ![]() . East of the Continental Divide in Wyoming and Colorado saw temperatures colder than average by 3–12°F, as repeated Arctic cold waves sloshed into those areas. West of the Divide, including all of Utah, temperatures were 3–9°F warmer than average. Worland, in central Wyoming, was 11.5°F below normal for the month, while about 300 miles away, Salt Lake City was 7.9°F above normal for the month, an almost 20-degree differential in the anomaly.
. East of the Continental Divide in Wyoming and Colorado saw temperatures colder than average by 3–12°F, as repeated Arctic cold waves sloshed into those areas. West of the Divide, including all of Utah, temperatures were 3–9°F warmer than average. Worland, in central Wyoming, was 11.5°F below normal for the month, while about 300 miles away, Salt Lake City was 7.9°F above normal for the month, an almost 20-degree differential in the anomaly.
The latest US Drought Monitor, representing conditions as of March 11 ![]() , shows improvement since early February in areas of central and northeastern Colorado (from D0 to drought-free), central and northern Wyoming (from D1 to D0, and D2 to D1) and northern Utah (D2 to D1). The proportion of the region in D2 or worse drought changed little, with Utah nudged down from 13% to 11%, Colorado remaining at 14%, and Wyoming unchanged at zero.
, shows improvement since early February in areas of central and northeastern Colorado (from D0 to drought-free), central and northern Wyoming (from D1 to D0, and D2 to D1) and northern Utah (D2 to D1). The proportion of the region in D2 or worse drought changed little, with Utah nudged down from 13% to 11%, Colorado remaining at 14%, and Wyoming unchanged at zero.
Current Snowpack
The Current Basin Snowpack map from NRCS ![]() shows most of the region with near- to much-above-normal SWE. With the storm tracks since January favoring Wyoming and northern Colorado, those areas have about 120% of median SWE or greater, with over 140% of median SWE in western, north-central, and southeastern Wyoming, and northeastern Colorado. Conditions in northern Utah have improved considerably since February 1, with SWE now at 100–120% of median. Central and southern Utah, especially in the southwestern corner, have been drier and warmer the past two months and snowpacks are below-median (45–90%) and some have even started early melt. Southwestern and south-central Colorado are also lagging behind the basins to the north, at around 90% of median.
shows most of the region with near- to much-above-normal SWE. With the storm tracks since January favoring Wyoming and northern Colorado, those areas have about 120% of median SWE or greater, with over 140% of median SWE in western, north-central, and southeastern Wyoming, and northeastern Colorado. Conditions in northern Utah have improved considerably since February 1, with SWE now at 100–120% of median. Central and southern Utah, especially in the southwestern corner, have been drier and warmer the past two months and snowpacks are below-median (45–90%) and some have even started early melt. Southwestern and south-central Colorado are also lagging behind the basins to the north, at around 90% of median.
Current Streamflows
The maps of current streamflows for Colorado ![]() , Utah
, Utah ![]() , and Wyoming
, and Wyoming ![]() show that the majority of Wyoming gages are ice-affected and have no data, while in Utah and Colorado many gages are now reporting. Of the gages that are reporting, flows are mainly normal or above normal Wyoming and Colorado, while they are mainly normal or below normal in Utah.
show that the majority of Wyoming gages are ice-affected and have no data, while in Utah and Colorado many gages are now reporting. Of the gages that are reporting, flows are mainly normal or above normal Wyoming and Colorado, while they are mainly normal or below normal in Utah.
Spring-Summer Streamflow Forecasts
The Westwide Streamflow Forecast Map based on the NRCS March 1 forecasts shows that most forecast points in Wyoming and northern and central Colorado are expected to have above-average (110–129%) or much-above-average (130–149%) spring and summer runoff. Most forecast points in south-central and southwestern Colorado, and much of Utah, are expected to have below-average (70–89%) to much-below-average (50-69%) spring and summer runoff, with a handful of points expected to have far-below-average (25–49%) runoff, and two points in the under-25% category. Many points in northern Utah and west-central Colorado are expected to have near-average (90–109%) runoff.
The watersheds in the northern Front Range of Colorado that were most affected by the floods last September now have unusually large snowpacks, generally over 150% of median SWE for early March and above the 90th percentile. The NRCS March 1 forecasts for these basins call for above-average (110–129%) seasonal runoff. According to NOAA NWS, there is a high risk of minor snowmelt flooding in these basins. Since stream channels are impacted by debris and excess sediment in many locations in these basins, the risk and severity of flooding may be greater than in previous high-runoff years. Multiple state and federal agencies are cooperating to remove debris and sediment from these channels in preparation for high runoff.
IMPORTANT NOTE: While NRCS and NOAA continue to collaborate on streamflow forecasts, the forecast values are no longer being strictly coordinated between NRCS and some of the RFCs, including the CBRFC. For example, the NRCS March 1 forecast for Lake Powell April–July inflows is 7800 KAF, 109% of average. The NOAA CBRFC March 1 forecast for Lake Powell inflows is 8300 KAF, 116% of average.
Seasonal Climate and Drought Forecasts
The latest monthly Climate Outlook released on February 28th by NOAA CPC shows only a slight wet tilt in precipitation for far southern Utah and Colorado for March ![]() . The seasonal outlooks released February 20 show no tilt in precipitation for our region for the March–May
. The seasonal outlooks released February 20 show no tilt in precipitation for our region for the March–May ![]() and April–June
and April–June ![]() periods. The latest CPC Seasonal Drought Outlook released February 20
periods. The latest CPC Seasonal Drought Outlook released February 20 ![]() projects that the areas of drought conditions (D1 or worse) in our region, in Utah and southeastern Colorado, will persist through at least May, but no additional drought development is expected.
projects that the areas of drought conditions (D1 or worse) in our region, in Utah and southeastern Colorado, will persist through at least May, but no additional drought development is expected.
As reported in the previous briefing, the PSD experimental April 1 SWE forecast for Colorado released in mid-January has the median (50th percentile) forecast ![]() calling for near or above-average April 1 snowpack (92–110% of average) for all basins, with the highest forecasted SWE in the Arkansas and Yampa-White basins, and the lowest SWE in the San Juan-San Miguel-Dolores and Rio Grande basins.
calling for near or above-average April 1 snowpack (92–110% of average) for all basins, with the highest forecasted SWE in the Arkansas and Yampa-White basins, and the lowest SWE in the San Juan-San Miguel-Dolores and Rio Grande basins.
In the ENSO arena, we finally have a real prospect of change. While ENSO indicators are still showing ENSO-neutral conditions![]()
![]() , the forecast models are increasingly pointing towards development of El Niño conditions. The IRI ENSO Prediction Plume
, the forecast models are increasingly pointing towards development of El Niño conditions. The IRI ENSO Prediction Plume ![]() for mid-February shows that starting in the mid-summer period (June–August) just under half of the models call for El Niño onset, with about half remaining in neutral territory. The early March update of NOAA CPC/IRI’s probabilistic forecast shows marginally higher likelihoods of El Niño development by summer, at or just above 50%.
for mid-February shows that starting in the mid-summer period (June–August) just under half of the models call for El Niño onset, with about half remaining in neutral territory. The early March update of NOAA CPC/IRI’s probabilistic forecast shows marginally higher likelihoods of El Niño development by summer, at or just above 50%.
Accordingly, NOAA CPC has hoisted an El Niño Watch, indicating that “conditions are favorable for the development of El Niño conditions within the next six months.” An experimental PSD regression-based MEI forecast issued March 10 projects a higher likelihood of El Niño development, at 64% probability for the July–September period.
February 14, 2014
Highlights
-
January precipitation was highly variable over the region, with wetter-than-average conditions across northern and central Wyoming and the northern two-thirds of Colorado. Potent systems in early February brought heavy precipitation to most mountain areas, especially northern Utah, northern Colorado, and southwestern Wyoming.
-
As of February 13, snowpack conditions have improved significantly since late January. All basins in Wyoming, all but one basin in Colorado, and basins in northern and south-central Utah have near-normal to above-normal SWE (>90% of median); most basins in Wyoming and northern Colorado are at over 120% of median SWE.
-
The February 1 spring-summer streamflow forecasts call for northern and central Colorado, and northern and eastern Wyoming to have near-average or above-average spring and summer runoff. South-central and southwestern Colorado, southwestern Wyoming, and Utah are expected to have below-average to much-below-average spring and summer runoff. These forecasts do not reflect the most recent improvement to the snowpack.
Click on the thumbnail images in the text below to bring up the full-sized graphic
January and early February Precipitation and Temperatures, and Current Drought
Precipitation in January was very unevenly distributed across our region, with storm tracks generally favoring the northern areas. The northern two-thirds of Colorado and much of northern and central Wyoming ended up wetter than average, while south-central and southwest Wyoming, southern Colorado, and nearly all of Utah were drier than average ![]() . Even drier conditions occurred just to the south, as New Mexico and Arizona received virtually no precipitation for the month.
. Even drier conditions occurred just to the south, as New Mexico and Arizona received virtually no precipitation for the month.
An active weather pattern at the end of January continued in early February. From February 7–10 a deep flow of Pacific moisture from an atmospheric river (AR) event penetrated unusually far to the east, bringing at least 2” of moisture to most high mountain areas in northern and central Utah, Wyoming, and Colorado. Northern Utah and northwestern Colorado were especially favored by this event, with up to 8” of SWE accumulating in the northern Wasatch Range and 7” in the Park Range near Steamboat Springs. A second, more northerly, AR event was affecting northwestern Wyoming, northern Utah, and northern Colorado as of February 13.
Temperatures across the region in January were less exceptional than in December ![]() . Most of the region was warmer than average, especially in southern Utah and southwestern Wyoming. Portions of northern and central Colorado, central Wyoming, and northern Utah were colder than average.
. Most of the region was warmer than average, especially in southern Utah and southwestern Wyoming. Portions of northern and central Colorado, central Wyoming, and northern Utah were colder than average.
The latest US Drought Monitor, representing conditions as of February 11 ![]() , shows improvement since early January in areas of northwestern Colorado (from D0 to drought-free) and in northern Utah (from D1 to D0, and D2 to D1) and south-central and western Wyoming (D0 to drought-free) D1 to D0. Conversely, areas in southwestern and northeastern Colorado degraded from drought-free to D0. The proportion of the region in D2 or worse drought changed little, with Utah nudged down from 14% to 13%, Colorado remaining at 14%, and Wyoming unchanged at zero.
, shows improvement since early January in areas of northwestern Colorado (from D0 to drought-free) and in northern Utah (from D1 to D0, and D2 to D1) and south-central and western Wyoming (D0 to drought-free) D1 to D0. Conversely, areas in southwestern and northeastern Colorado degraded from drought-free to D0. The proportion of the region in D2 or worse drought changed little, with Utah nudged down from 14% to 13%, Colorado remaining at 14%, and Wyoming unchanged at zero.
Snowpack
The Current Basin Snowpack map from NRCS ![]() shows that conditions have improved significantly for most of the region in the past two weeks. The most recent storms favored the north, while leaving southern Utah, and portions of southwestern Colorado with little or no new snow. As of February 13, SWE is near-normal or above-normal (>90% of median) in every Wyoming basin, all of Colorado except the Rio Grande, and south-central and northern Utah, with the best conditions (>135% of median SWE) in north-central and northeastern Wyoming, and north-central Colorado. Snowpacks are below normal to much below normal in southwestern and southeastern Utah, with the driest basins at around 60% of median SWE.
shows that conditions have improved significantly for most of the region in the past two weeks. The most recent storms favored the north, while leaving southern Utah, and portions of southwestern Colorado with little or no new snow. As of February 13, SWE is near-normal or above-normal (>90% of median) in every Wyoming basin, all of Colorado except the Rio Grande, and south-central and northern Utah, with the best conditions (>135% of median SWE) in north-central and northeastern Wyoming, and north-central Colorado. Snowpacks are below normal to much below normal in southwestern and southeastern Utah, with the driest basins at around 60% of median SWE.
Current Streamflows
The maps of current streamflows for Colorado ![]() , Utah
, Utah ![]() , and Wyoming
, and Wyoming ![]() show that the majority of gages are ice-affected and have no data, which is typical for this time of year. Among the gages still reporting, no clear tendencies are apparent.
show that the majority of gages are ice-affected and have no data, which is typical for this time of year. Among the gages still reporting, no clear tendencies are apparent.
Spring-Summer Streamflow Forecasts
The February 1 spring-summer streamflow forecasts were released by NOAA CBRFC and the NRCS in early February. Note that the heavy snow accumulation in many basins in early February is not reflected in the forecasts, and there may be large improvements in the March 1 forecasts, relative to the February 1 forecasts. The CBRFC’s ESP (Ensemble Streamflow Prediction) forecasts are updated daily and can be accessed here.
The Westwide Streamflow Forecast Map based on the NRCS February 1 forecasts shows that most forecast points in northern and central Colorado, and northern and eastern Wyoming are expected to have near-average (90–109%) or above-average (110–129%) spring and summer runoff. Most forecast points in south-central and southwestern Colorado, southwestern Wyoming, and Utah are expected to have below-average (70–89%) to much-below-average (50-69%) spring and summer runoff, with a handful of points expected to have far-below-average (25–49%) runoff.
IMPORTANT NOTE: While NRCS and NOAA continue to collaborate on streamflow forecasts, the forecast values are no longer being strictly coordinated between NRCS and some of the RFCs, including the CBRFC. For example, the NRCS February 1 forecast for Lake Powell April–July inflows is 6700 KAF, 94% of average. The NOAA CBRFC February 1 forecast for Lake Powell inflows is 7250 KAF, 101% of average.
Seasonal Climate and Drought Forecasts
The latest monthly Climate Outlook released on January 31st by NOAA CPC shows no tilt in precipitation for our regiong for January ![]() . The seasonal outlooks released January 16 shows a tilt towards drier conditions, strongest in the Southwest, progressively edging into southern Utah and southern Colorado in the February–April
. The seasonal outlooks released January 16 shows a tilt towards drier conditions, strongest in the Southwest, progressively edging into southern Utah and southern Colorado in the February–April ![]() and March–May periods
and March–May periods ![]() . The latest CPC Seasonal Drought Outlook released January 16
. The latest CPC Seasonal Drought Outlook released January 16 ![]() projects that the areas of drought conditions (D1 or worse) in our region, mainly in Utah, will persist through at least April, with additional areas of drought developing in southeastern Utah and southern Colorado.
projects that the areas of drought conditions (D1 or worse) in our region, mainly in Utah, will persist through at least April, with additional areas of drought developing in southeastern Utah and southern Colorado.
The new PSD Precipitation Forecast Guidance ("SWcast") released January 17 for January–March 2014 ![]() shows a dry tilt over much of northern and central Colorado, with the strongest dry tilt (-10%) over north-central Colorado. A wet tilt is shown over southern Utah and southwestern Colorado.
shows a dry tilt over much of northern and central Colorado, with the strongest dry tilt (-10%) over north-central Colorado. A wet tilt is shown over southern Utah and southwestern Colorado.
The PSD experimental April 1 SWE forecast for Colorado released in mid-January has the median (50th percentile) forecast ![]() calling for near or above-average April 1 snowpack (92–110% of average) for all basins, with the highest forecasted SWE in the Arkansas and Yampa-White basins, and the lowest SWE in the San Juan-San Miguel-Dolores and Rio Grande basins.
calling for near or above-average April 1 snowpack (92–110% of average) for all basins, with the highest forecasted SWE in the Arkansas and Yampa-White basins, and the lowest SWE in the San Juan-San Miguel-Dolores and Rio Grande basins.
ENSO indicators ![]()
![]() are yet again showing ENSO-neutral conditions, with Niño 3.4 right at the zero-anomaly line and the MEI slightly below zero. IRI has not updated their ENSO Prediction Plume since mid-December, so the current forecasts are not displayed in the Dashboard. But this February 6 update from NOAA CPC addresses the current forecasts: “Nearly all model forecasts indicate the persistence of ENSO-neutral [conditions] through the Northern Hemisphere spring 2014, but afterwards, an increasing number of models suggest the possible onset of El Niño.”
are yet again showing ENSO-neutral conditions, with Niño 3.4 right at the zero-anomaly line and the MEI slightly below zero. IRI has not updated their ENSO Prediction Plume since mid-December, so the current forecasts are not displayed in the Dashboard. But this February 6 update from NOAA CPC addresses the current forecasts: “Nearly all model forecasts indicate the persistence of ENSO-neutral [conditions] through the Northern Hemisphere spring 2014, but afterwards, an increasing number of models suggest the possible onset of El Niño.”
January 10, 2014
Highlights
-
December precipitation was highly variable over the region, with wetter-than-average conditions across most of Wyoming and northeastern Colorado, and drier-than-average across most of Utah, southwestern Wyoming, and the rest of Colorado, particularly southeastern Colorado.
-
With the bitter cold wave early in the month, December saw colder-than-average temperatures throughout most of the region, with portions of northeastern Utah ending up more than 15°F below average.
-
Snowpack conditions have deteriorated in most basins since early December and are generally near to above normal in Wyoming and Colorado, but generally below normal in Utah.
-
The January 1 spring-summer streamflow forecasts show a mixed bag for the region, with most basins in northern and western Colorado, northern and eastern Wyoming, and southeastern Utah expected to have near-average or above-average runoff, while most basins in southeastern Colorado, southwestern Wyoming, and the remainder of Utah are expected to have below-average to much-below-average runoff.
-
The NOAA CPC climate outlooks show a slight dry tilt for southern Colorado and Utah for late winter (January–March).
Click on the thumbnail images in the text below to bring up the full-sized graphic
December Precipitation and Temperatures, and Current Drought
Over much of the region, most of December’s precipitation fell in the first week, associated with the strong cold wave. Storm tracks generally stayed to the north for the rest of the month. Most of Wyoming, western Utah, far northeastern Utah, and central Colorado ended the month wetter than average, while the rest of Utah, and southern and eastern Colorado were drier than average ![]() .
.
Temperatures in December were colder than average across nearly all of the region ![]() . Utah and western Colorado experienced the largest and most widespread cold anomalies, with most locations more than 6°F below normal and parts of northeastern Utah more than 15°F below normal. These monthly anomalies were driven by a very strong cold wave during the first week of December. Denver experienced below-zero low temperatures for six days in a row, the longest such stretch in December since 1972. Grand Junction was 13°F below normal for the month, including 10 days with below-zero temperatures, compared to the long-term average of 1 below-zero day in December. Early January conditions have been near or above average over most of the region.
. Utah and western Colorado experienced the largest and most widespread cold anomalies, with most locations more than 6°F below normal and parts of northeastern Utah more than 15°F below normal. These monthly anomalies were driven by a very strong cold wave during the first week of December. Denver experienced below-zero low temperatures for six days in a row, the longest such stretch in December since 1972. Grand Junction was 13°F below normal for the month, including 10 days with below-zero temperatures, compared to the long-term average of 1 below-zero day in December. Early January conditions have been near or above average over most of the region.
The latest US Drought Monitor, representing conditions as of January 7 ![]() , shows improvement since early December in areas of central Utah (from D2 to D1) and eastern Utah (D1 to D0). Also, north-central Wyoming improved (from D0 to drought-free) due to above-average December and early fall precipitation. Drought conditions worsened in portions of east-central Colorado (D0 to D1) and southeastern Colorado (D1 to D2). The proportion of the region in D2 or worse drought saw little change, with Utah at 14% (down by 2%), Colorado at 14% (up by 2%), and Wyoming at zero (no change).
, shows improvement since early December in areas of central Utah (from D2 to D1) and eastern Utah (D1 to D0). Also, north-central Wyoming improved (from D0 to drought-free) due to above-average December and early fall precipitation. Drought conditions worsened in portions of east-central Colorado (D0 to D1) and southeastern Colorado (D1 to D2). The proportion of the region in D2 or worse drought saw little change, with Utah at 14% (down by 2%), Colorado at 14% (up by 2%), and Wyoming at zero (no change).
Snowpack
The Current Basin Snowpack map from NRCS ![]() indicates that conditions have deteriorated in many basins due to below-average snowfall since early December. As of January 9, basins have near-normal or above-normal SWE (>90% of median) across nearly all of Wyoming, most of Colorado, and in south-central Utah, with the best conditions (>130% of median SWE) in north-central and northeastern Wyoming. Snowpacks are below normal to much below normal in the rest of Utah, southwestern Wyoming, and southwestern Colorado, with the driest basins at or just below 70% of median SWE. A storm coming in January 9th-12th should boost snowpacks in the northwestern Wyoming, northern Utah, and northern Colorado but will not help the southern part of the region.
indicates that conditions have deteriorated in many basins due to below-average snowfall since early December. As of January 9, basins have near-normal or above-normal SWE (>90% of median) across nearly all of Wyoming, most of Colorado, and in south-central Utah, with the best conditions (>130% of median SWE) in north-central and northeastern Wyoming. Snowpacks are below normal to much below normal in the rest of Utah, southwestern Wyoming, and southwestern Colorado, with the driest basins at or just below 70% of median SWE. A storm coming in January 9th-12th should boost snowpacks in the northwestern Wyoming, northern Utah, and northern Colorado but will not help the southern part of the region.
Current Streamflows
The maps of current streamflows for Colorado ![]() , Utah
, Utah ![]() , and Wyoming
, and Wyoming ![]() show that the majority of gages are ice-affected and have no data, which is typical for this time of year. Among the gages still reporting, no clear tendencies are apparent. December unregulated inflows into Lake Powell were 81% of average.
show that the majority of gages are ice-affected and have no data, which is typical for this time of year. Among the gages still reporting, no clear tendencies are apparent. December unregulated inflows into Lake Powell were 81% of average.
Spring-Summer Streamflow Forecasts
The first spring-summer streamflow forecasts of the season, valid January 1, were released by NOAA CBRFC and the NRCS in early January. The NRCS Westwide Streamflow Forecast Map shows that most forecast points in northern and western Colorado, northern and eastern Wyoming, and southeastern Utah are expected to have near-average (90-109%) or above-average (110-129%) spring and summer runoff. Most forecast points in south-central Colorado, southwestern Wyoming, and the remainder of Utah are expected to have below-average (70-89%) to much-below-average (50-69%) spring and summer runoff.
IMPORTANT NOTE: While NRCS and NOAA continue to collaborate on streamflow forecasts, the forecast values are no longer being strictly coordinated between NRCS and some of the RFCs, including the CBRFC. For example, the NRCS January 1 forecast for Lake Powell April-July inflows is 6500 KAF, 91% of average. The NOAA CBRFC January 1 forecast for the same point is 6810 KAF, 95% of average. Also note that the January 1 forecasts do not reflect declines in snowpack since the first of the month.
Seasonal Climate and Drought Forecasts
The latest monthly Climate Outlook released on December 31st by NOAA CPC shows a slight wet tilt for precipitation for northern Wyoming for January ![]() , and a slight dry tilt for southwestern Utah. The seasonal outlooks released December 19 show a slight tilt towards drier conditions for southern Utah and central Colorado, but no tilt elsewhere in the region, for the January–March period
, and a slight dry tilt for southwestern Utah. The seasonal outlooks released December 19 show a slight tilt towards drier conditions for southern Utah and central Colorado, but no tilt elsewhere in the region, for the January–March period ![]() . For the February–April period, a slight dry tilt is shown for far southern Utah and the southwestern corner of Colorado
. For the February–April period, a slight dry tilt is shown for far southern Utah and the southwestern corner of Colorado ![]() . The latest CPC Seasonal Drought Outlook released December 19
. The latest CPC Seasonal Drought Outlook released December 19 ![]() projects that most of the areas of drought conditions (D1 or worse) in our region, mainly in Utah, will persist through at least March, with additional areas of drought developing in southeastern Utah and western Colorado.
projects that most of the areas of drought conditions (D1 or worse) in our region, mainly in Utah, will persist through at least March, with additional areas of drought developing in southeastern Utah and western Colorado.
As reported in the previous briefing, the PSD Precipitation Forecast Guidance ("SWcast") released November 13 for January–March 2014 ![]() shows a dry tilt over nearly all of Utah and Colorado, with the strongest dry tilt (-10%) over north-central Colorado. Even so, the non-ENSO indicators in the Pacific Ocean, and in the Atlantic Ocean, are not as suggestive of drought as they were last year at this time.
shows a dry tilt over nearly all of Utah and Colorado, with the strongest dry tilt (-10%) over north-central Colorado. Even so, the non-ENSO indicators in the Pacific Ocean, and in the Atlantic Ocean, are not as suggestive of drought as they were last year at this time.
ENSO indicators ![]()
![]() are yet again showing ENSO-neutral conditions, with Niño 3.4 right at the zero-anomaly line and the MEI slightly below zero. The models in IRI's mid-December ENSO Prediction Plume
are yet again showing ENSO-neutral conditions, with Niño 3.4 right at the zero-anomaly line and the MEI slightly below zero. The models in IRI's mid-December ENSO Prediction Plume ![]() once again indicate a consensus towards ENSO-neutral conditions continuing through the winter into spring, with both the dynamical and statistical models tending towards the warm side of neutral, and a handful of models calling for El Niño conditions by summer.
once again indicate a consensus towards ENSO-neutral conditions continuing through the winter into spring, with both the dynamical and statistical models tending towards the warm side of neutral, and a handful of models calling for El Niño conditions by summer.
December 10, 2013
Highlights
-
A major storm on a southerly track in late November led to much-above-average monthly precipitation for southeastern and west-central Utah and western and south-central Colorado.
-
Snowpacks are above normal across nearly all of the three-state region, with the wettest basins (>140% of median) in northern Wyoming, southern Utah, and the southern half of Colorado, and the driest basins (80–100% of median) in northern and central Utah and far southwestern Wyoming.
-
The NOAA CPC climate outlooks show a wet tilt for Wyoming over the next three months, with a slight dry tilt for southern Colorado and Utah for late winter (January–March). The NOAA PSD ‘SWcast’ is more pessimistic, showing a dry tilt for most of Colorado and Utah for late winter.
Click on the thumbnail images in the text below to bring up the full-sized graphic
November Precipitation and Temperatures, and Current Drought
While the storm tracks in October favored the northern part of our region, in late November a major storm took a southerly path, resulting in above-average precipitation for the month ![]() in southeastern and west-central Utah, and in western and south-central Colorado. Nearly all of Wyoming, northern Utah, and eastern Colorado were drier than average. The mountain areas in Colorado and in southern Utah generally received above-average precipitation.
in southeastern and west-central Utah, and in western and south-central Colorado. Nearly all of Wyoming, northern Utah, and eastern Colorado were drier than average. The mountain areas in Colorado and in southern Utah generally received above-average precipitation.
Temperatures in November were slightly warmer than average, by 0–2°F, across most of the region![]() except for those areas with the most precipitation, which were slightly cooler. (The still-lingering severe cold wave that moved into region starting December 2–4 will be covered in the January briefing.)
except for those areas with the most precipitation, which were slightly cooler. (The still-lingering severe cold wave that moved into region starting December 2–4 will be covered in the January briefing.)
The latest US Drought Monitor, representing conditions as of December 3 ![]() , shows improvement since early November in areas of southern Utah (from D1 to D0) and southwestern Colorado (D0 to drought-free) that received much-above-average precipitation in November. The proportion of the region in D2 or worse drought remained steady, with Utah at 16%, Colorado at 12%, and Wyoming at zero.
, shows improvement since early November in areas of southern Utah (from D1 to D0) and southwestern Colorado (D0 to drought-free) that received much-above-average precipitation in November. The proportion of the region in D2 or worse drought remained steady, with Utah at 16%, Colorado at 12%, and Wyoming at zero.
Snowpack
The Current Basin Snowpack map from NRCS ![]() indicates above-normal SWE in nearly all basins in our region—a welcome change from early December conditions in the previous two winters. The largest positive anomalies, with over 140% of median SWE for the date, are in northern Wyoming, southern Utah, and the southern half of Colorado, reflecting the very wet October in Wyoming, the wet November in the southern mountains, and a generally wet start to December. Snowpacks are below normal in several basins in northern and central Utah and far southwestern Wyoming, but no basin has less than 80% of median SWE as of December 9.
indicates above-normal SWE in nearly all basins in our region—a welcome change from early December conditions in the previous two winters. The largest positive anomalies, with over 140% of median SWE for the date, are in northern Wyoming, southern Utah, and the southern half of Colorado, reflecting the very wet October in Wyoming, the wet November in the southern mountains, and a generally wet start to December. Snowpacks are below normal in several basins in northern and central Utah and far southwestern Wyoming, but no basin has less than 80% of median SWE as of December 9.
Current Streamflows
The maps of current streamflows for Colorado ![]() , Utah
, Utah ![]() , and Wyoming
, and Wyoming ![]() show an increasing number of ice-affected gages with no data, and other data may be unreliable as the cold wave of early December is affecting lower-elevation gages unusually early. The Colorado River near Cisco, UT gage was just beginning to freeze up on December 6, with flows in the 44th percentile (96% of median flow).
show an increasing number of ice-affected gages with no data, and other data may be unreliable as the cold wave of early December is affecting lower-elevation gages unusually early. The Colorado River near Cisco, UT gage was just beginning to freeze up on December 6, with flows in the 44th percentile (96% of median flow).
Seasonal Climate and Drought Forecasts
The latest monthly Climate Outlook released on November 30 by NOAA CPC shows a wet tilt for precipitation for Wyoming for December ![]() , but no tilt elsewhere. The seasonal outlooks released November 21 show a slight tilt towards wetter conditions for most of Wyoming, but no tilt elsewhere in the region, for the December–February period
, but no tilt elsewhere. The seasonal outlooks released November 21 show a slight tilt towards wetter conditions for most of Wyoming, but no tilt elsewhere in the region, for the December–February period ![]() . For the January–March period, a slight dry tilt is shown for southern Utah and Colorado
. For the January–March period, a slight dry tilt is shown for southern Utah and Colorado ![]() . The latest CPC Seasonal Drought Outlook released November 21
. The latest CPC Seasonal Drought Outlook released November 21 ![]() projects that most of the areas of drought conditions (D1 or worse) in our region, mainly in Utah, will persist through at least February, except for improvement along Utah’s Wasatch Front and in east-central Wyoming.
projects that most of the areas of drought conditions (D1 or worse) in our region, mainly in Utah, will persist through at least February, except for improvement along Utah’s Wasatch Front and in east-central Wyoming.
The PSD Precipitation Forecast Guidance ("SWcast") released November 13 for January–March 2014 ![]() shows a dry tilt over nearly all of Utah and Colorado, with the strongest dry tilt (-10%) over north-central Colorado. Even so, the non-ENSO indicators in the Pacific Ocean, and in the Atlantic Ocean, are not as suggestive of drought as they were last year at this time.
shows a dry tilt over nearly all of Utah and Colorado, with the strongest dry tilt (-10%) over north-central Colorado. Even so, the non-ENSO indicators in the Pacific Ocean, and in the Atlantic Ocean, are not as suggestive of drought as they were last year at this time.
The experimental January 1 SWE forecast for Colorado released in early October has the median (50th percentile) forecast ![]() calling for above-average January 1 snowpack (109–117% of average) for all basins except the Yampa (93%) and Rio Grande (98%).
calling for above-average January 1 snowpack (109–117% of average) for all basins except the Yampa (93%) and Rio Grande (98%).
ENSO indicators ![]()
![]() are still showing ENSO-neutral conditions, though with a warming trend over the past few months.The models in IRI's mid-November ENSO Prediction Plume
are still showing ENSO-neutral conditions, though with a warming trend over the past few months.The models in IRI's mid-November ENSO Prediction Plume ![]() once again indicate a consensus towards ENSO-neutral conditions continuing through the winter, though both the dynamical and statistical models are tending towards the warm side of neutral, with several models calling for El Niño conditions by spring.
once again indicate a consensus towards ENSO-neutral conditions continuing through the winter, though both the dynamical and statistical models are tending towards the warm side of neutral, with several models calling for El Niño conditions by spring.
November 11, 2013
Highlights
-
Above-average October precipitation in Wyoming and northern and western Colorado further alleviated drought conditions and provided a good start to the winter snowpack.
-
Precipitation was below-average in Utah and southern and eastern Colorado, though cool temperatures across the region in October helped retain the snow that did fall.
-
The NOAA CPC climate outlooks show a tilt towards continued wet conditions for Wyoming into the winter months, with no tilt for the rest of the region.
October Precipitation and Temperatures, and Current Drought
In October, storm tracks favored the Northern Plains and left nearly all of Wyoming with above-normal precipitation![]() ; much of the state was over 200% of normal. To the south, this wet anomaly extended into northern Colorado and far western Colorado, and a portion of eastern Utah. The rest of Colorado and Utah saw drier-than-normal conditions, including persistently drought-stricken southeastern Colorado.
; much of the state was over 200% of normal. To the south, this wet anomaly extended into northern Colorado and far western Colorado, and a portion of eastern Utah. The rest of Colorado and Utah saw drier-than-normal conditions, including persistently drought-stricken southeastern Colorado.
After the relatively dry conditions during the first 10 days of November, the current HPRCC Water Year Precipitation map for 2014![]() shows essentially the same pattern as for the month of October.
shows essentially the same pattern as for the month of October.
October’s temperatures were cooler than average across the region—and across the entire western US—even in those areas with below-average precipitation![]() . Most areas were 2–6°F below average monthly temperatures for October, which helped keep the new snow in the mountains on the ground.
. Most areas were 2–6°F below average monthly temperatures for October, which helped keep the new snow in the mountains on the ground.
The latest US Drought Monitor, representing conditions as of November 5 ![]() , shows further improvement in the persistent drought conditions over the past month. The most significant improvements were in southern and eastern Wyoming, where D2 and D3 drought conditions on October 1 improved to D0 and D1. Lesser improvements occurred in south-central and northwestern Colorado. The proportion of Wyoming in D2 or worse drought dropped to zero, from 22% on October 1; Utah remained at 16%; and Colorado remained at 12%. Region-wide, the overall drought extent and severity is now lower than it has been since early 2012.
, shows further improvement in the persistent drought conditions over the past month. The most significant improvements were in southern and eastern Wyoming, where D2 and D3 drought conditions on October 1 improved to D0 and D1. Lesser improvements occurred in south-central and northwestern Colorado. The proportion of Wyoming in D2 or worse drought dropped to zero, from 22% on October 1; Utah remained at 16%; and Colorado remained at 12%. Region-wide, the overall drought extent and severity is now lower than it has been since early 2012.
Snowpack
The Current Basin Snowpack map from NRCS ![]() indicates near- to above-average SWE in all but a handful of basins in our region, with the largest positive anomalies in Wyoming, southern Utah, and northwestern Colorado. We are still very early in the snowpack season, and the % of average SWE values are more volatile than later in the season. With average to dry conditions forecasted for the region for the next 5
indicates near- to above-average SWE in all but a handful of basins in our region, with the largest positive anomalies in Wyoming, southern Utah, and northwestern Colorado. We are still very early in the snowpack season, and the % of average SWE values are more volatile than later in the season. With average to dry conditions forecasted for the region for the next 5 ![]() to 14 days, these values may slip backwards by late November, especially in Utah and much of Colorado where the actual SWE amounts on the ground are generally less than 2".
to 14 days, these values may slip backwards by late November, especially in Utah and much of Colorado where the actual SWE amounts on the ground are generally less than 2".
Current Streamflows
The maps of current streamflows for Colorado ![]() , Utah
, Utah ![]() , and Wyoming
, and Wyoming ![]() show that streams in the region are generally in lower flow categories than one month ago, but most are still in the normal or above-normal categories. The Colorado River near the CO-UT state line was in the 40th percentile (96% of median flow) on November 9.
show that streams in the region are generally in lower flow categories than one month ago, but most are still in the normal or above-normal categories. The Colorado River near the CO-UT state line was in the 40th percentile (96% of median flow) on November 9.
Seasonal Climate and Drought Forecasts
The latest monthly Climate Outlook released on October 31 by NOAA CPC shows a slight dry tilt for precipitation for November ![]() extending into extreme southern Colorado, but no tilt elsewhere. The seasonal outlooks released October 17 show a tilt towards wetter conditions for most of Wyoming, but no tilt elsewhere in the region, for the November–January period
extending into extreme southern Colorado, but no tilt elsewhere. The seasonal outlooks released October 17 show a tilt towards wetter conditions for most of Wyoming, but no tilt elsewhere in the region, for the November–January period ![]() , and no tilt for the December–February period
, and no tilt for the December–February period ![]() . The latest CPC Seasonal Drought Outlook released October 17 projects that the remaining areas of drought conditions (D1 or worse) in our region, mainly in Utah, will persist through at least January
. The latest CPC Seasonal Drought Outlook released October 17 projects that the remaining areas of drought conditions (D1 or worse) in our region, mainly in Utah, will persist through at least January ![]() .
.
As reported in the October 8 briefing, the PSD Precipitation Forecast Guidance ("SWcast") released September 11 for October–December 2013 conditions ![]() shows a slight wet tilt for the period for far northeastern Colorado, and a dry tilt for most of eastern Colorado into the northern Front Range. No tilt is forecasted for the rest of Colorado and Utah, indicating equal chances for wet, dry, and middle outcomes. The fall-early winter period historically has shown the least forecast skill of all seasons, though there has been positive skill east of the Continental Divide.
shows a slight wet tilt for the period for far northeastern Colorado, and a dry tilt for most of eastern Colorado into the northern Front Range. No tilt is forecasted for the rest of Colorado and Utah, indicating equal chances for wet, dry, and middle outcomes. The fall-early winter period historically has shown the least forecast skill of all seasons, though there has been positive skill east of the Continental Divide.
Also reported in the October 8 briefing: in the experimental January 1 SWE forecast for Colorado released in early October, the median (50th percentile) forecast ![]() calls for above-average January 1 snowpack (109–117% of average) for all basins except the Yampa (93%) and Rio Grande (98%).
calls for above-average January 1 snowpack (109–117% of average) for all basins except the Yampa (93%) and Rio Grande (98%).
ENSO indicators ![]()
![]() are still showing ENSO-neutral conditions, though with a warming trend over the past few months. The models in IRI's mid-October ENSO Prediction Plume
are still showing ENSO-neutral conditions, though with a warming trend over the past few months. The models in IRI's mid-October ENSO Prediction Plume ![]() once again indicate a consensus towards ENSO-neutral conditions continuing through the winter, though now both the dynamical and statistical models are tending towards the warm side of neutral, with a few models sneaking into El Niño territory by spring.
once again indicate a consensus towards ENSO-neutral conditions continuing through the winter, though now both the dynamical and statistical models are tending towards the warm side of neutral, with a few models sneaking into El Niño territory by spring.
October 8, 2013
Highlights
-
A widespread heavy precipitation event in mid-September caused severe flooding on Colorado’s Front Range but also relieved drought conditions across the region.
-
September precipitation was greater than 200% of average over most of the region; it was likely the wettest month across the region in at least five years.
-
Many reservoirs, including Lake Powell, experienced gains in storage at a time in the year they are usually declining.
-
The NOAA CPC climate outlooks show a dry tilt for Colorado and Utah for the month of October.
Click on the thumbnail images in the text below to bring up the full-sized graphic
September Precipitation and Temperatures, and Current Drought
September ended the 2013 water year on a very wet note across the region, with most of the region receiving at least 200% of normal precipitation, and only a few small areas seeing drier-than-normal conditions ![]() . The last month with comparable wet anomalies across the region was December 2007. A persistent rain event from September 9th–17th, caused by a late monsoonal surge from the south reinforced in eastern Colorado by very moist upslope flow, brought most of the month's precipitation, including extraordinary totals for Boulder, Colorado (9" in 24 hours; 17” in seven days) and the surrounding area. (See the WWA’s preliminary assessment of the Front Range rain event and the severe flooding it caused.)
. The last month with comparable wet anomalies across the region was December 2007. A persistent rain event from September 9th–17th, caused by a late monsoonal surge from the south reinforced in eastern Colorado by very moist upslope flow, brought most of the month's precipitation, including extraordinary totals for Boulder, Colorado (9" in 24 hours; 17” in seven days) and the surrounding area. (See the WWA’s preliminary assessment of the Front Range rain event and the severe flooding it caused.)
Other areas with over 5” of precipitation for the month included far southeastern Wyoming, south-central Utah, the Uinta Basin in northeastern Utah, the southeastern Yellowstone Plateau, and the San Juans in southwestern Colorado.
With this late surge, the final HPRCC Water Year Precipitation map ![]() for 2013 showed that the previously scattered areas with above-average precipitation since October 1 have enlarged and merged, covering perhaps one-third of the three-state region, with the wettest areas in northeastern Colorado, southern Utah, and northern Wyoming. But, as in the 2012 water year, most of the region still ended up drier than normal.
for 2013 showed that the previously scattered areas with above-average precipitation since October 1 have enlarged and merged, covering perhaps one-third of the three-state region, with the wettest areas in northeastern Colorado, southern Utah, and northern Wyoming. But, as in the 2012 water year, most of the region still ended up drier than normal.
Despite all the precipitation, the temperatures in September![]() were warmer than average across the region, except in parts of western Utah and western Colorado. Most areas were 1–6°F above monthly average temperatures for September.
were warmer than average across the region, except in parts of western Utah and western Colorado. Most areas were 1–6°F above monthly average temperatures for September.
The latest US Drought Monitor, representing conditions as of October 1 ![]() , shows significant and widespread improvement in the persistent drought conditions, by one to three categories, compared to one month ago. The most dramatic improvements were in northeastern Colorado, where up to D2 drought conditions were brought to normal, and in southwestern Colorado, where D3 drought improved to D0
, shows significant and widespread improvement in the persistent drought conditions, by one to three categories, compared to one month ago. The most dramatic improvements were in northeastern Colorado, where up to D2 drought conditions were brought to normal, and in southwestern Colorado, where D3 drought improved to D0 ![]() . The proportion of Colorado in D2 or worse drought dropped from 60% on September 3 down to 12% on October 1; in Utah, 54% down to 16%; and in Wyoming, 48% to 22%. Region-wide, the overall drought extent and severity is now lower than it has been since April 2012.
. The proportion of Colorado in D2 or worse drought dropped from 60% on September 3 down to 12% on October 1; in Utah, 54% down to 16%; and in Wyoming, 48% to 22%. Region-wide, the overall drought extent and severity is now lower than it has been since April 2012.
Current Streamflows
As with the other hydroclimatic indicators, the maps of current streamflows for Colorado ![]() , Utah
, Utah ![]() , and Wyoming
, and Wyoming ![]() clearly show the effect of the prodigious September precipitation. In Colorado and Wyoming, there are many gages in the much above normal (dark blue) and high (black) categories, and relatively few in the below-normal categories. Utah has a more equitable distribution across the flow categories. The Colorado River near the CO-UT state Line was in the 64th percentile (118% of median flow) on October 5.
clearly show the effect of the prodigious September precipitation. In Colorado and Wyoming, there are many gages in the much above normal (dark blue) and high (black) categories, and relatively few in the below-normal categories. Utah has a more equitable distribution across the flow categories. The Colorado River near the CO-UT state Line was in the 64th percentile (118% of median flow) on October 5.
Aided by very high flows on the San Juan River, Lake Powell received inflows of 0.86 MAF in September, over 200% of the average inflows for September, and over twice the combined inflows in July and August this year. As a result, the final water year inflows to Powell should come in closer to 5.0 MAF (47% of average), versus the 4.3 MAF projected at the beginning of September.
Reservoir Storage
The well-above-average precipitation in many parts of the region provided an unexpected but welcome boost to reservoirs at a time of year they are typically dropping towards their winter-early spring low stands. In the flooding-affected drainages of Colorado’s Front Range, several small to mid-size (<50 KAF) reservoirs filled and spilled, while large reservoirs in western Colorado saw well-above-average inflows and gains in storage, including Dillon, Blue Mesa and Navajo Reservoirs.
On September 30, Lake Powell held 10.93 MAF (45% full), up from the 10.79 MAF held on August 31, and more significantly, well above the 10.5 MAF (43% full) projected in early September as the end-of-water-year contents. The surface elevation of Powell on September 30 was 5 feet higher than had been projected three weeks earlier.
Seasonal Climate and Drought Forecasts
The latest monthly Climate Outlook released on September 30 by NOAA CPC show a dry tilt for precipitation for October ![]() covering all of Colorado and Utah, and southern Wyoming. The seasonal outlooks released September 19 show a slight tilt towards wetter conditions in far northern Wyoming, but no tilt elsewhere in the region, for the October–December period
covering all of Colorado and Utah, and southern Wyoming. The seasonal outlooks released September 19 show a slight tilt towards wetter conditions in far northern Wyoming, but no tilt elsewhere in the region, for the October–December period ![]() , and a slight wet tilt in northern Wyoming and a slight dry tilt for southern Colorado and Utah for the November–January period
, and a slight wet tilt in northern Wyoming and a slight dry tilt for southern Colorado and Utah for the November–January period ![]() . The CPC Climate Outlooks once again show enhanced odds for above-normal temperatures for the upcoming seasons
. The CPC Climate Outlooks once again show enhanced odds for above-normal temperatures for the upcoming seasons ![]()
![]() , consistent with long-term warming trends. The latest CPC Seasonal Drought Outlook released September 19 projects that drought conditions over most of our region, though much improved last month, will persist through at least December, with no additional improvement expected.
, consistent with long-term warming trends. The latest CPC Seasonal Drought Outlook released September 19 projects that drought conditions over most of our region, though much improved last month, will persist through at least December, with no additional improvement expected.
The PSD Precipitation Forecast Guidance ("SWcast") released September 11 for October–December 2013 conditions ![]() shows a slight wet tilt for the period for far northeastern Colorado, and a dry tilt for most of eastern Colorado into the northern Front Range. No tilt is forecasted for the rest of Colorado and Utah, indicating equal chances for wet, dry, and middle outcomes. The fall-early winter period historically has shown the least forecast skill of all seasons, though there has been positive skill east of the Continental Divide.
shows a slight wet tilt for the period for far northeastern Colorado, and a dry tilt for most of eastern Colorado into the northern Front Range. No tilt is forecasted for the rest of Colorado and Utah, indicating equal chances for wet, dry, and middle outcomes. The fall-early winter period historically has shown the least forecast skill of all seasons, though there has been positive skill east of the Continental Divide.
Klaus Wolter of NOAA PSD has also issued the first experimental January 1 SWE forecast for Colorado, with separate forecasts for the seven state water divisions, which follow the major river basins. The median (50th percentile) ![]() forecast calls for above-average January 1 snowpack (109–117% of average) for all basins except the Yampa (93%) and Rio Grande (98%).
forecast calls for above-average January 1 snowpack (109–117% of average) for all basins except the Yampa (93%) and Rio Grande (98%).
Stop us if you've heard this one before: ENSO indicators ![]() continue to show ENSO-neutral conditions, as they have for the past 12 months. The models in IRI's mid-September ENSO Prediction Plume
continue to show ENSO-neutral conditions, as they have for the past 12 months. The models in IRI's mid-September ENSO Prediction Plume ![]() again indicate a consensus towards ENSO-neutral conditions continuing through the fall and early winter, with the dynamical models tending towards the warm side of neutral, and the statistical models tending to stay on the cool side.
again indicate a consensus towards ENSO-neutral conditions continuing through the fall and early winter, with the dynamical models tending towards the warm side of neutral, and the statistical models tending to stay on the cool side.
September 5, 2013
Highlights
-
Short-term drought has been relieved across most of Colorado and southern Utah; long-term drought conditions have also improved in many areas of Colorado, with less improvement in Utah and Wyoming.
-
August precipitation was very mixed over the region, with Colorado and southern Utah generally wetter than average, and Wyoming and northern Utah drier than average
-
The very low inflows into Lake Powell this water year, and resulting reservoir levels, are triggering a less-than-typical release from Powell to the Lower Basin in water year 2014.
-
The NOAA CPC climate outlooks show a wet tilt for much of Utah and Colorado for the month of September, and a wet tilt for far northern Wyoming for the fall period.
Click on the thumbnail images in the text below to bring up the full-sized graphic
August Precipitation and Temperatures, and Current Drought
Throughout August, the monsoon continued to bring subtropical moisture into the region, but the results were more spotty than in July. Much of Colorado, southern Utah, and far northeastern Wyoming were wetter than average, but northern Utah and the rest of Wyoming were drier than average![]() . The southern Front Range including Colorado Springs saw 5–8" of rainfall for the month, with some locations seeing about half of their annual average. Conversely, parts of far northern Utah and central and northern Wyoming had less than 25% of average precipitation, and these same areas were also very dry in July. With one month left in the water year, the HPRCC Water Year Precipitation map
. The southern Front Range including Colorado Springs saw 5–8" of rainfall for the month, with some locations seeing about half of their annual average. Conversely, parts of far northern Utah and central and northern Wyoming had less than 25% of average precipitation, and these same areas were also very dry in July. With one month left in the water year, the HPRCC Water Year Precipitation map ![]() still shows only isolated parts of the region with above-average precipitation since October 1.
still shows only isolated parts of the region with above-average precipitation since October 1.
As in July, the temperatures in August![]() were warmer than average across most of the region, except in parts of southern Utah and western Colorado. Most areas were 1–4°F above monthly average temperatures for August. Salt Lake City was again the hot spot, capping off its hottest summer (June–August) ever with a record-hot August 2013 which averaged 82.7°F (5.7°F above average).
were warmer than average across most of the region, except in parts of southern Utah and western Colorado. Most areas were 1–4°F above monthly average temperatures for August. Salt Lake City was again the hot spot, capping off its hottest summer (June–August) ever with a record-hot August 2013 which averaged 82.7°F (5.7°F above average).
Many of the areas that were wetter-than-average during August have improved by one or two categories in the latest US Drought Monitor ![]() representing conditions as of September 3. The largest areas of improvement are in northeastern Colorado (to D1) and southeastern Colorado (to D2/D3)
representing conditions as of September 3. The largest areas of improvement are in northeastern Colorado (to D1) and southeastern Colorado (to D2/D3)![]() . In Wyoming there were smaller areas of improvement in the northeastern and southeastern corners, while D1 expanded slightly in the northwestern corner. In Utah, there was an expansion of D2 in the northwestern part of the state. Overall, drought conditions across the region are similar to where they were at the beginning of June, with improvement in Colorado balanced by drying in Utah and Wyoming.
. In Wyoming there were smaller areas of improvement in the northeastern and southeastern corners, while D1 expanded slightly in the northwestern corner. In Utah, there was an expansion of D2 in the northwestern part of the state. Overall, drought conditions across the region are similar to where they were at the beginning of June, with improvement in Colorado balanced by drying in Utah and Wyoming.
Current Streamflows
The maps of current streamflows across Colorado ![]() and Utah
and Utah![]() , show more gages in the "normal" (green) and above-normal categories, compared to one month ago. In Wyoming, however, there has been no improvement since early August, and below-normal gages still outnumber the normal and above-normal gages. The Colorado River near the CO-UT state Line was in the 41st percentile (95% of median flow) on September 4, very similar to early August.
, show more gages in the "normal" (green) and above-normal categories, compared to one month ago. In Wyoming, however, there has been no improvement since early August, and below-normal gages still outnumber the normal and above-normal gages. The Colorado River near the CO-UT state Line was in the 41st percentile (95% of median flow) on September 4, very similar to early August.
The Bureau of Reclamation's latest forecast for unregulated water-year 2013 inflows to Lake Powell is 4.3 MAF (40% of average). This would make 2000-2013 the driest 14-year period on record, averaging 8.2 MAF compared to the 1981–2010 mean of 10.8 MAF.
Reservoir Storage
At this time of year, the region's reservoirs are typically slipping towards their winter-early spring low stands. On August 31, Lake Powell ![]() held 10.79 MAF (44% full), down from 14.15 MAF (58% full) on the same day last year.
held 10.79 MAF (44% full), down from 14.15 MAF (58% full) on the same day last year.
According to Reclamation's 24-Month Study Report released August 16, the level of Lake Powell is forecasted to fall just below 3575' by January 1, 2014', which, in combination with Lake Mead being above 1025', triggers the Mid-Elevation Release Tier, in which 7.48 MAF would be released from Powell in water year 2014. This would likely be the first release of less than 8 MAF since Lake Powell first filled in the early 1980s.
Seasonal Climate and Drought Forecasts
The latest monthly Climate Outlooks released on August 31 by NOAA CPC show a slight wet tilt for precipitation for September![]() covering most of Utah and the western two-thirds of Colorado. The seasonal outlooks released August show a tilt towards wetter conditions in far northern Wyoming, but no tilt elsewhere in the region, for the and September–November and October–December periods
covering most of Utah and the western two-thirds of Colorado. The seasonal outlooks released August show a tilt towards wetter conditions in far northern Wyoming, but no tilt elsewhere in the region, for the and September–November and October–December periods ![]()
![]() . The CPC Climate Outlooks once again show enhanced odds for above-normal temperatures for the upcoming seasons, consistent with long-term warming trends. The latest CPC Seasonal Drought Outlook released August 15 projects that drought conditions will persist for most of our region through November, but further improvement is expected in south-central Coloradoup through the Front Range over the next three months.
. The CPC Climate Outlooks once again show enhanced odds for above-normal temperatures for the upcoming seasons, consistent with long-term warming trends. The latest CPC Seasonal Drought Outlook released August 15 projects that drought conditions will persist for most of our region through November, but further improvement is expected in south-central Coloradoup through the Front Range over the next three months.
As reported in the previous briefing: The PSD Precipitation Forecast Guidance ("SWcast") released July 12 for July–September 2013 conditions, shows a wet tilt for the period for eastern Colorado, and a stronger dry tilt for the northern Front Range, similar to the previous forecast for this period issued in May. Both of the regions showing tilt have shown modest positive forecast skill for the late-summer/early fall over the last decade. No tilt is forecasted for the rest of Colorado and Utah, indicating equal chances for wet, dry, and middle outcomes.
ENSO indicators continue to show ENSO-neutral conditions, as they have since last fall. The models in IRI's mid-August ENSO Prediction Plume again indicate a consensus towards ENSO-neutral conditions continuing through the fall and early winter, with the dynamical models tending towards the warm side of neutral, and the statistical models tending to stay on the cool side. The model envelope suggests some chance of weak El Niño or La Niña conditions developing this winter.
August 7, 2013
Highlights
-
Short-term drought conditions have eased considerably over the region after a wet July, with lesser improvements in long-term drought conditions.
-
July precipitation was above average over most of the region; Colorado and Utah were wetter overall than Wyoming.
-
Observed April through July runoff was boosted only marginally by the monsoon moisture, and still ended up well below average in most basins.
-
At the end of July, reservoirs across the region were generally lower than at this time last year, and almost all were below the long-term average.
-
The NOAA CPC seasonal climate outlooks show equal chances for wet or dry conditions for the region through November, except for a wet tilt for far northern Wyoming for August.
Click on the thumbnail images in the text below to bring up the full-sized graphic
July Precipitation and Temperatures, and Current Drought
July was a rare month for this water year: the majority of the region experienced above-average precipitation, as a timely and active monsoon consistently brought subtropical moisture into the region. Conditions were generally wetter across Utah and Colorado than Wyoming, with the largest wet anomalies in southwestern Utah and far western Colorado. Conversely, extreme north-central Utah, far northwestern Colorado, and parts of southwestern Wyoming were mostly skipped by the July rains. We are far enough along in the water year that one good month scarcely changed the HPRCC Water Year Precipitation map, which still shows only isolated areas with above-average precipitation since October 1.
Despite the moisture, July temperatures were warmer than average across most of the region, except in parts of eastern Colorado and far northeastern Wyoming. Most areas were 0-4°F above monthly average temperatures for July. The hot spot for the region was Salt Lake City, where July 2013 clocked in at an average of 84.1°F (5.4°F above average), the warmest July and warmest month since the official record began in 1928, just beating out July 2007.
After the July rains, the latest US Drought Monitor representing conditions as of July 30, shows multiple small areas of improvement by one category: along the Colorado Front Range (to D0), along the Wasatch Front (to D0), in southwestern Utah (to D0), far northeastern Colorado (to D1 and D2), and southeastern Colorado (to D3). There was also some expansion of D3 in south-central Wyoming, and east-central Colorado. Last year there was considerable expansion of drought area during July—which did not occur this year—so overall conditions are now somewhat better than at this time last year.
Current Streamflows
Once again, in the maps of current streamflows across Colorado, Utah, and Wyoming, there are more gages in the below-normal categories than the above-normal categories, but more gages are in the "normal" (green) category than one month ago. The July rains have had a positive effect on streamflows in many Colorado and Utah basins. For example, the Colorado River near the CO-UT state Line jumped from from the 8th percentile on July 1 to the 46th percentile (95% of median flow) on August 4. This gain was not just relative to the median; streamflows actually increased from about 3000 cfs to 3600 cfs over this period.
However, this boost in July streamflows has been “too little, too late”, and has not substantially increased the overall low to very low April–July runoff across the region, especially in the Upper Colorado River Basin. The preliminary observed unregulated inflows to Lake Powell for April through July totaled 2.55 MAF (39% of median), well below the "most probable" June 1 forecast of 3.0 MAF. This was the 4th lowest spring-summer runoff since 1964, below 1981 but above 2012.
Reservoir Storage
After a second straight year of generally poor April–July inflows, the region’s reservoirs tended to reach their seasonal peak levels "early and low" this year. As of July 31, the vast majority of reservoirs were below the long-term average for the date, and generally below last year's level as well. On July 31, Lake Powell held 11.20 MAF (46% full), down from 14.68 MAF (60% full) on the same day last year.
Seasonal Climate and Drought Forecasts
The latest monthly Climate Outlooks released on July 31 by NOAA CPC show a wet tilt for precipitation for August in far northern Wyoming, but no tilt elsewhere. The seasonal outlooks released July 18 show no tilt towards wetter or drier conditions for the August–October and September–November periods. The CPC Climate Outlooks once again show enhanced odds for above-normal temperatures for the upcoming seasons, consistent with long-term warming trends. The latest CPC Seasonal Drought Outlook released July 18 projects that drought conditions will persist for most of our region through October, but further improvement is expected in southeastern Utah and southwestern and south-central Colorado over the next three months, reflecting the expected continuation of what has been a robust monsoon so far.
The latest PSD Precipitation Forecast Guidance ("SWcast") released July 12 for July–September 2013 conditions, shows a wet tilt for the period for eastern Colorado, and a stronger dry tilt for the northern Front Range, similar to the previous forecast for this period issued in May. Both of the regions showing tilt have shown modest positive forecast skill for the late-summer/early fall over the last decade. No tilt is forecasted for the rest of Colorado and Utah, indicating equal chances for wet, dry, and middle outcomes.
ENSO indicators still continue to show ENSO-neutral conditions, as they have since last fall. The models in IRI's mid-July ENSO Prediction Plume again indicate a consensus towards ENSO-neutral conditions continuing through the fall, with the dynamical models tending towards the warm side of neutral, and the statistical models tending to stay on the cool side. Several models call for a quick cooling into La Niña conditions by fall, but most of those do not continue the La Niña event through the winter. A few dynamical models forecast the development of weak El Niño conditions by late winter.
July 2, 2013 (updated July 9)
Highlights
-
Severe to exceptional drought conditions have gained more ground in our region after a dry June; significant drought impacts will continue.
-
June precipitation was below average over nearly all of the region except for northeastern Wyoming and portions of southeastern Colorado; most of Utah received no precipitation for the month.
-
Observed runoff from April through June was generally well below average across the region.
-
Region-wide, reservoir storage at the end of June was lower than at this time last year, and below the long-term average.
-
The NOAA CPC seasonal climate outlooks show equal chances for wet or dry conditions over the next several months, except in a few small areas.
Note: Special WWA-NIDIS drought briefing available
On June 26, WWA and the National Integrated Drought Information System (NIDIS) released a two-page Summer 2013 Drought Summary and Outlook for Colorado, Utah, Wyoming, and New Mexico. This briefing summarizes recent precipitation, current and expected drought conditions, spring-summer streamflows, reservoir levels, agricultural impacts, and wildfire risk.
Click on the thumbnail images in the text below to bring up the full-sized graphic
June Precipitation and Temperatures, and Current Drought
June brought little relief for our drought-stricken region, with only northeastern Wyoming and portions of southeastern Colorado seeing above-average precipitation. Most of Utah, far western Colorado, and parts of southwestern Wyoming received virtually no precipitation. The HPRCC Water Year Precipitation mapstill shows only isolated areas with above-average precipitation since October 1.
June temperatures were warmer than average across the region, with most areas being 2-6°F above monthly average temperatures.
The latest US Drought Monitor, representing conditions as of July 2, shows an expansion of D3 (extreme) drought conditions since early June in the Four Corners region, extreme south-central Utah, and far northeastern Colorado. An area of abnormally dry (D0) conditions along Colorado's Front Range has deteriorated to D1 (moderate drought). The region on the whole is experiencing a similar proportion of severe (D2) or worse drought compared to early July 2012, though with a different spatial pattern than last year.
Current Streamflows
In the maps of current streamflows across the three states, there are many more gages in the below-normal categories than the above-normal categories. The runoff peak has passed at all gages, and western Colorado in particular has seen many gages drop categories in the last month. For example, the Colorado River near the CO-UT State Line dropped from the 15th percentile on June 7, to the 8th percentile (36% of median flow) on July 1.
The observed volumes this spring and early summer have been on track with the dry outlook of the official forecasts. With the low June precipitation, the observed unregulated inflows to Lake Powell are running below the "most probable" forecast of 3.0 MAF for the April–July period, and will likely end up closer to 2.7 MAF for the period, which would make it the 5th lowest spring runoff on record, just below 1981 but above 2012.
Reservoir Storage
The second year of below-average runoff has further depleted the region’s water storage. At the end of June, most reservoirs across the region had less storage than last year, and the vast majority were below the long-term average for the date. There was some recovery of reservoir storage in the Upper Colorado headwaters and the adjacent portion of the South Platte basin with near-average runoff there, but storage decreases were predominant in other basins, including the North Platte, Arkansas, Rio Grande, San Juan, Green, and the Wasatch Front basins. On June 30, Lake Powell held 11.76 MAF (48% full), down from 15.29 MAF (63% full) last year.
Seasonal Climate and Drought Forecasts
The latest monthly Climate Outlooks released on June 30 by NOAA CPC show a wet tilt for precipitation for July in far southern Utah and Colorado, reflecting the expectation for an active Southwest monsoon. The seasonal outlooks released June 20 show a tilt towards drier-than-average conditions for the July–September and August–October periods only for far northwestern Wyoming, and no tilt for the rest of the region. The CPC Climate Outlooks once again show enhanced odds for above-normal temperatures for the upcoming seasons, consistent with the long-term warming trend. The latest CPC Seasonal Drought Outlook released June 20 projects that drought conditions will persist for most of our region, but some improvement is expected in far southern Utah and extreme southwestern Colorado over the next three months, again reflecting the monsoon.
ENSO indicators continue to show ENSO-neutral conditions. Since last fall, ENSO conditions have not exerted much influence on the climate system, nor on the seasonal forecasts. The models in IRI's mid-June ENSO Prediction Plume again indicate a consensus towards ENSO-neutral conditions continuing through the fall, with the dynamical models tending towards the warm side of neutral, and the statistical models tending to stay on the cool side, with a few models calling for development of La Niña conditions by the end of summer.
June 10, 2013
Highlights
-
The region is heading into summer with long-term drought conditions comparable to or worse than early June 2012 in nearly all areas; significant drought impacts (water supply, agricultural, wildfire) can be expected
-
May precipitation was above average in central Colorado, far northern Wyoming, and portions of eastern Utah, and below-average in northern Utah, southeastern Wyoming, and southern and eastern Colorado.
-
Snowpacks have melted out except at the highest elevations; snowmelt occurred 1-3 weeks earlier than the median in most basins.
-
The latest (June 1) runoff forecasts continue to call for below-average or well-below-average spring-summer streamflow over nearly all of the region; observed flows in April and May were generally well below average
-
The NOAA CPC seasonal climate outlooks show a dry "tilt" for summer precipitation for southeastern Colorado, but no tilt elsewhere. The “SWcast” for July–September shows a slight wet tilt over eastern Colorado, and a dry tilt over north-central Colorado and northern Utah.
Click on the thumbnail images in the text below to bring up the full-sized graphic
May Precipitation and Temperatures, and Current Drought
As in April, May brought variable precipitation for the region, with central Colorado, far northern Wyoming, and portions of eastern Utah seeing well above-average precipitation. Northern Utah, southeastern Wyoming, and southern and eastern Colorado saw below-average precipitation. The HPRCC Water Year Precipitation map shows a handful of areas with above-average water-year precipitation, but most of the region has experienced drier-than-normal conditions since October 1.
May temperatures were very close to average across the region, with nearly all areas departing less than 2°F from monthly average temperatures. Wyoming overall was slightly warmer than average, and Utah and Colorado were split between warmer- and cooler-than-average conditions.
The latest US Drought Monitor, representing conditions as of June 4, shows some amelioration in drought conditions since late April in north-central Colorado, northern Utah, and northern Wyoming. An area of severe (D2) drought in southwestern Colorado and extreme southeastern Utah has deteriorated to D3 (extreme). Overall, the percentage of each state classified in severe (D2) or worse drought has decreased, with Colorado still highest at 71%, and Utah and Wyoming both at 47%. Colorado remains the only state in the region with D4 (exceptional) drought, occupying much of the southeastern quadrant of the state. Despite the recent improvement, however, the region on the whole is experiencing worse drought conditions than in early June 2012.
Current Snowpack and Streamflows
By early June, the vast majority of SNOTEL sites across the region have melted out, and this year is no exception. Thus the % of normal SWE values, as seen in the the Current Basin Snowpack map from NRCS, need to be treated with extreme caution. That said, the map broadly conveys the state of the remaining high-elevation snowpack: below-normal to near-normal conditions in northern and central Colorado, and south-central and north-central Wyoming, and much below normal or prematurely melted out elsewhere.
In the maps of current streamflows across the three states, Colorado is seeing an increased number of gages in the above-normal categories compared to a month ago, reflecting the seasonal peak runoff in those basins with near-normal snowpacks. But across all three states, there are more gages in the below-normal categories than the above-normal categories. The Colorado River near the CO-UT State Line has slipped from the 24th percentile on May 2 to the 15th percentile (52% of median flow) on June 7, reflecting overall below-normal snowpacks in the Colorado headwaters and the Gunnison basins.
Spring-Summer Streamflow Forecasts
The June 1 spring-summer streamflow forecasts from NOAA and the NRCS have deteriorated compared with May 1 for most basins across the region, except for the Colorado headwaters and upper Gunnison basin, which saw above-normal May precipitation. The NRCS Westwide Streamflow Forecast Map shows that the vast majority of basins are forecasted to have well-below-average (50–69%) or lower runoff. For Lake Powell inflows, the official CBRFC forecast for June 1 is at 3.0 MAF (42% of average), unchanged from the May 1 forecast.
Note that these April–July runoff forecasts issued on June 1 include two months of observed streamflow (April and May). The observed volumes this spring have been consistent with the dry outlooks of the previous months' forecasts; across the Upper Colorado River Basin, for example, observed streamflows for May ranged from 40–85% of average.
(NOTE: While NRCS and NOAA continue to collaborate on streamflow forecasts, the forecast values are no longer being strictly coordinated between NRCS and some of the RFCs, including the CBRFC.)
Seasonal Climate and Drought Forecasts
The latest monthly Climate Outlooks released on May 31 by NOAA CPC show a dry tilt for precipitation for June in northern Utah, western Wyoming, and southeastern Colorado. The seasonal outlooks released May 16 show a tilt towards drier-than-average conditions for the June–August period for southeastern Colorado, but no tilt for the rest of the region. The CPC Climate Outlooks once again show enhanced odds for above-normal temperatures for the upcoming seasons, consistent with the long-term warming trend. The latest CPC Seasonal Drought Outlook released June 6 projects that drought conditions will persist for most of our region, but some improvement is expected in eastern Wyoming and northeastern Colorado over the next three months.
As reported in the previous briefing, the SWcast released April 15 for late summer (July–September) has a slight dry tilt for northwestern Utah, and also for extreme north-central Colorado and southern Wyoming, with a slight wet tilt for eastern Colorado.
ENSO indicators continue to show ENSO-neutral conditions. Since last fall, ENSO conditions have not exerted much influence on the climate system, nor on the seasonal forecasts. The models in IRI's mid-May ENSO Prediction Plume indicate a consensus towards ENSO-neutral conditions continuing through next summer and fall, with the dynamical models tending towards the warm side of neutral, and the statistical models tending to stay on the cool side, with a few models calling for development of weak La Niña conditions by the end of summer.
May 6, 2013 (updated May 7)
Highlights
-
Recent snows have improved the runoff picture, but most of the Intermountain West is still facing low or very low 2013 spring-summer runoff with reservoirs already at low levels
-
April precipitation was mixed for the region, with northern and central Colorado, portions of Wyoming, and eastern Utah being wetter than average, and northern Utah, southwestern Wyoming, and southern Colorado being mainly drier than average.
-
Snowpacks in eastern Utah, much of Wyoming, and northern and central Colorado saw large gains in April, reaching near-normal peak levels and delaying snowmelt. Southern Colorado and southern Utah did not see these gains and meltout began early, from well-below-normal peaks.
-
May 1 forecasts for spring-summer streamflow for the region are still below-average or well-below-average except in far northwestern Wyoming, but are generally improved from the April 1 forecasted flows across Wyoming, northern and eastern Utah, and northern and central Colorado.
-
The NOAA CPC seasonal climate outlooks show a dry "tilt" for spring and summer precipitation for most of our region. In contrast, the “SWcast” for April–June shows a wet tilt over much of Colorado.
April Precipitation and Temperatures, and Current Drought
April brought a mixed bag of precipitation for the region , with storms consistently favoring northern and central Colorado, portions of Wyoming, and eastern Utah, with some areas seeing over 200% of normal precipitation. Conversely, northern Utah, southwestern Wyoming, and southern Colorado were mostly skipped by these storms and saw below-average precipitation. The HPRCC Water Year Precipitation map shows that the wetter areas in April have emerged as the largest "green islands" of above-average water-year precipitation, in a sea of drier-than-normal conditions since October 1. Southeastern Colorado remains by far the driest part of the region over that period, with isolated pockets in southern Colorado and in Utah also seeing less than 50% of average October–April precipitation.
Several severe cold-air outbreaks led to April temperatures being colder than average across the region , except for parts of southeastern Utah and southwestern Colorado. Dozens of daily record-low minimum temperatures were set during April throughout the region, including 2°F in Boulder, CO on April 10, and -7°F in Cody, WY on April 9, which was also a monthly record for April.
The latest US Drought Monitor, representing conditions as of April 30, shows further improvement in regional drought conditions since late March; extreme (D3) drought in central western Colorado and central Wyoming has been upgraded to D2 and D1. While majority of the region is still classified in severe (D2) or worse drought, relatively little is now in D3 and D4, with the largest and most persistent area of D4 occupying most of southeastern Colorado.
Current Snowpack and Streamflows
As reported in the previous briefing, a series of storms after April 8 significantly boosted snowpacks in many mountain areas, with the last storm sweeping in on April 30. This late in the season, the % of normal SWE values, as seen in the the Current Basin Snowpack map from NRCS, can be misleading since nearly all SNOTEL sites have typically begun to melt out by now. But it is fair to say that the basins in northern and central Colorado, northeastern Utah, and much of Wyoming clawed their way back to near-normal (90–100%) snowpack conditions at the higher elevations by May 1. Snowpacks in southern Utah and southern Colorado did not seem the same boost in April as the basins to the north, and the snow there has been melting out steadily since mid-April, leaving May 1 values at 70% of normal or less, even at the highest elevations. Overall, the snowpack picture for the region is generally improved over April 1.
In Colorado, the new snow in April was accompanied by two substantial dust-on-snow events, with the storm on April 15–16 depositing dust from the San Juans to the Front Range. The dust loading in the San Juans is now similar to the high-dust springs of 2009 and 2010, and has been speeding up the snowmelt. In the northern and central mountains of Colorado, the dust layers are still buried for the most part, but once exposed will likewise cause earlier meltout than in the absence of dust. As WWA researcher Jeff Deems was quoted in the Denver Post, the April snow was "a mixed blessing" because of the dust deposition.
In the maps of current streamflows across the three states, the “normal” category is most frequently reported, but with more gages in the below-normal categories than above-normal, particularly in Wyoming. The Green River near Greendale, UT gage, was in the 12th percentile, at only 55% of the median flow for May 2, probably reflecting delayed snowmelt with the recent storms. Similarly, the Colorado River near the CO-UT State Line was in the 24th percentile, at 63% of the median flow for May 2. These flows should improve relative to normal as snowmelt picks up over the next few weeks.
Spring-Summer Streamflow Forecasts
Like the snowpacks, the May 1 spring-summer streamflow forecasts from NOAA and the NRCS are generally improved across the region compared with April 1, except in southern Colorado and southern Utah. The NRCS Westwide Streamflow Forecast Map shows a strong north-south gradient, with basins in northern Wyoming forecasted to have near-average (90–109%) or below-average (70–89%) runoff; in southern Wyoming, northern and central Colorado, and northern and eastern Wyoming, mainly below-average (70–89%) or well-below-average (50–69%) runoff; and in southern Utah and southern Colorado, far-below-average (25–49%) runoff. Only a few small basins remain in the very lowest category (<25% of average). For Lake Powell inflows, the official CBRFC forecast for May 1 is at 3.0 MAF (42% of average), slightly higher than the April 1 forecast of 2.7 MAF.
The runoff outlook for the region is lower than the final snowpack numbers (and their late-season improvement) would suggest, which reflects the unusually dry soil moisture last fall that is expected to significantly reduce runoff efficiency. (NOTE: While NRCS and NOAA continue to collaborate on streamflow forecasts, the forecast values are no longer being strictly coordinated between NRCS and some of the RFCs, including the CBRFC.)
Seasonal Climate and Drought Forecasts
The latest monthly Climate Outlooks released on April 30 by NOAA CPC show a slight dry tilt for precipitation for May in northern and western Wyoming. The seasonal outlooks released April 18 show a tilt towards drier-than-average conditions for the May–July period for all of the region, with the strongest tilt over western Colorado and eastern Utah. For the June–August period, the area with dry tilt shrinks and shifts to southeastern Colorado. The CPC Climate Outlooks once again show enhanced odds for above-normal temperatures for the upcoming seasons, consistent with the long-term warming trend. The latest CPC Seasonal Drought Outlookreleased May 2 projects that drought conditions will persist for most of our region, but some improvement is expected in far eastern Wyoming and the eastern half of Colorado over the next three months.
The latest PSD Precipitation Forecast Guidance ("SWcast")released April 12 for April–June 2013 conditions, continues to show a wet tilt for spring and early summer for Colorado, though shifted more to eastern Colorado compared with the SWcast released in March. A modest tilt towards dry conditions is forecasted for northwestern Utah. The SWcast released April 15 for late summer (July–September) continues the slight dry tilt for northwestern Utah, and also for extreme north-central Colorado and southern Wyoming, with a slight wet tilt for eastern Colorado.
ENSO indicators continue to show ENSO-neutral conditions, on the cool (La Niña) side of neutral. Since last fall, ENSO conditions have not exerted much influence on the climate system, nor on the seasonal forecasts. The models in IRI's mid-April ENSO Prediction Plume indicate a strong consensus towards ENSO-neutral conditions continuing through next summer and fall, with the dynamical models tending towards the warm side of neutral, and the statistical models tending to stay on the cool side.
April 24, 2013
Current Snowpack
Several potent spring storms since April 8 have given the snowpacks a significant late boost in Wyoming, northern and central Utah, and northern and central Colorado, with many SNOTEL sites accumulating 2-6" of SWE over the two-week period. The Current Basin Snowpack map from NRCS shows many basins across the region now having 90–110% of median snowpack for April 23. While these values this late in the season can be misleading—the median snowpack curve has peaked and is declining at most sites after mid-April—the "current SWE as % of peak" values, especially at the highest-elevation sites, suggest that most of this recent increase in % of median is "real" and will be reflected in greater runoff than was forecasted on April 1.
The recent storms did not benefit southern Colorado and southern Utah nearly as much as farther north, and these basins remain at well below median snowpack.
Seasonal Climate and Drought Forecasts
The latest monthly and seasonal Climate Outlooks released on April 18 by NOAA CPC show no tilt for precipitation for May, but a tilt towards drier-than-average conditions for the May–July period for all of the region, with the stongest tilt over western Colorado and eastern Utah. For the June–August period. the area with dry tilt shrinks and shifts to southeastern Colorado. The CPC Climate Outlooks once again show enhanced odds for above-normal temperatures for the upcoming seasons, consistent with the long-term warming trend. The latest CPC Seasonal Drought Outlook released April 18 projects that over most of our region drought conditions will persist, but some improvement is expected in far eastern Wyoming and the eastern half of Colorado over the next three months.
April 5, 2013
Highlights
-
The Intermountain West is facing very low 2013 spring-summer runoff with reservoirs already depleted by dry conditions in 2012
-
March precipitation was below-average over nearly all of our region
-
April 1 SWE was below normal across the region, with most basins between 70-85% of normal
-
April 1 spring-summer streamflow forecasts call for less than 70% of average runoff in nearly all basins, with less than 50% of average runoff in many basins
-
The NOAA CPC seasonal climate outlooks show a dry "tilt" for late spring and early summer precipitation for most of our region, though the one-month outlook for April has no such tilt.
March Precipitation and Temperatures, and Current Drought
March was drier than average across the vast majority of the region, with driest conditions (>50% of average) in southern and northeastern Wyoming, southern Colorado, and northern and southeastern Utah. Only scattered areas saw above-average precipitation. The mountains across the region generally saw below-average precipitation. The HPRCC Water Year Precipitation map shows that almost the entire region has seen below-average precipitation since October 1. The largest area with <50% of average October–March precipitation is in southeastern Colorado.
March temperatures were warmer than average across most of Utah and in southwestern Colorado, and cooler than average elsewhere in the region. The largest cold anomalies, up to 6°F below average, were in northeastern Colorado and northern Wyoming.
The latest US Drought Monitor, representing conditions as of April 2, shows little change in regional drought conditions since early March. Most of the region is still classified in severe (D2) or worse drought: Colorado, 89% (unchanged since March 5); Wyoming, 84% (unchanged); and Utah, 46% (down from 52%).
Current Snowpack and Streamflows
With below-average March precipitation across nearly all mountain areas, snowpacks continued to slip with respect to normal (1981-2010 median) accumulation. April 1 SWE was well below normal across the region, with most basins between 70–85% of normal. Utah April 1 basin SWE was generally lower than on March 1, ranging from 70–90% of normal. In Colorado, April 1 basin SWE was similar to the March 1 values, at 66–82% of normal. In Wyoming, there was more variability, with the individual basin SWE ranging from 63–97% of normal. The April 1 basinwide SWE for the Upper Colorado River above Lake Powell slipped to 73% of normal, compared to 78% on March 1, and 84% on February 1.
In the maps of current streamflows across the three states, far more gages are in the below-normal categories than above-normal, particularly in Colorado. The Green River near Greendale, UT gage, was only in the 8th percentile, at 56% of the median flow for April 5. The Colorado River near the CO-UT State Line was in the 10th percentile, at 57% of the median flow for April 5.
Spring-Summer Streamflow Forecasts
The April 1 spring-summer streamflow forecasts from NOAA CBRFC and the NRCS are lower across the region than the March 1 forecasts. The NRCS Westwide Streamflow Forecast Map shows that most basins in our region are now expected to see well-below-average (50-69%) runoff or far-below-average (25-49%) runoff. Basins in northern Wyoming are in relatively better shape with forecasted below-average (70-89%) runoff. Several basins have slipped to the very lowest category (<25% of average).
For Lake Powell inflows, the official CBRFC forecast for April 1 is again lower than the previous months’, at 2.7 MAF (38% of average), compared to the March 1 forecast of 3.4 MAF. The very dry runoff outlook for the region reflects both the below-normal snowpacks and the unusually dry soil moisture last fall, which is expected to significantly reduce runoff efficiency in the spring. (NOTE: While NRCS and NOAA continue to collaborate on streamflow forecasts, the forecast values are no longer being strictly coordinated between NRCS and some of the RFCs, including the CBRFC.)
Seasonal Climate and Drought Forecasts
The latest monthly Climate Outlooks for April, released on April 1 by NOAA CPC, now show no tilt for April precipitation for our region, in contrast with a dry tilt in the previous outlook, and a tilt towards warmer temperatures for April over the region, especially Utah and Colorado.
As reported in the previous briefing: The latest seasonal (3-month) Climate Outlooks released on March 21 by NOAA CPC show a tilt towards drier-than-average conditions for late spring and early summer for western Colorado and all of Utah. The CPC Climate Outlooks continue to show enhanced odds for above-normal temperatures for the upcoming seasons, consistent with the long-term trend towards warmer conditions.
The latest CPC Seasonal Drought Outlook released April 4 projects that over most of our region drought conditions will persist, but some improvement is expected in far southeastern Wyoming and northeastern Colorado over the next three months.
ENSO indicators continue to show ENSO-neutral conditions on the cool (La Niña) side of neutral, and so we continue to see little influence of ENSO on the seasonal forecasts. The models in IRI's mid-March ENSO Prediction Plume indicate a consensus towards ENSO-neutral conditions continuing through next summer and fall.
March 22, 2013
Current Snowpack
The pattern seen in February with the region's snowpacks has continued since March 1, with storm tracks favoring Colorado and eastern Wyoming, where snowpacks have seen slight to moderate gains with respect to average conditions. Conversely, snowpacks in many Utah basins and in western Wyoming have slipped back. As a result, the Current Basin Snowpack map from NRCS shows nearly all basins across the region having 70–90% of average snowpack for March 22. Northwestern and north-central Wyoming have the highest basin snowpack levels, though still below average. The basinwide snowpack for the Upper Colorado River above Lake Powell as of March 22 is at 80% of average, up slightly from 78% of average on March 1. Last year at this time, the Upper Colorado River basinwide snowpack was almost identical to this year, at 81% of average. However, in 2012 the snowpack had reached a very early peak around March 20, while there is still the opportunity for further accumulation this year.
Seasonal Climate and Drought Forecasts
The latest monthly and seasonal Climate Outlooks released on March 21 by NOAA CPC continue to show a tilt towards drier-than-average conditions for late spring and early summer for western Colorado and all of Utah; this dry tilit is stronger than in the previous outlooks. The CPC Climate Outlooks continue to show enhanced odds for above-normal temperatures for the upcoming seasons, consistent with the long-term trend towards warmer conditions. The latest CPC Seasonal Drought Outlook released March 21 projects that over most of our region drought conditions will persist, but some improvement is expected in eastern Wyoming and northeastern Colorado over the next three months.
March 7, 2013
Highlights
-
February precipitation was mainly below-average for the region, with the driest conditions across Utah; eastern Colorado and central Wyoming saw above-average precipitation.
-
Snowpacks are now below-average in nearly every basin across the region after a dry February caused the snowpacks in Utah and western Wyoming to lose ground compared to average conditions
-
The March 1 spring-summer streamflow forecasts for the region call for well-below-average (<70%) runoff in nearly all basins, reflecting both the low snowpacks and the unusually low soil moisture last fall
-
The NOAA CPC seasonal climate outlooks show a dry "tilt" for spring and early summer precipitation for most of our region, though the one-month outlook for March has no tilt. In contrast, the “SWcast” for April–June shows a wet tilt over Colorado and eastern Utah.
February Precipitation and Temperatures, and Current Drought
February was drier-than-average across most of the region, with Utah overall the driest of the three states, especially in the far western and southern parts of the state. Mountain areas in northern Colorado and central and eastern Wyoming were generally favored by the prevailing storm tracks, and ended up with at least average precipitation, as did the plains adjacent to Colorado’s Front Range, and central Wyoming's basins. Mountain areas across Utah and in western Wyoming saw below-average precipitation. The HPRCC Water Year Precipitation map shows that almost the entire region has been drier than average since October 1. Southeastern Colorado remains the driest part of the region over that period, with less than 50% of average October–February precipitation.
February temperatures were colder than average across the region, except for parts of western and northeastern Wyoming. As in January, the largest cold anomalies, up to 15°F below average, were over Utah and were associated with persistent surface inversions. In northern Utah, a strong inversion caused another serious air pollution episode from February 2nd–6th.
The latest US Drought Monitor, representing conditions as of March 5, shows some improvement in regional drought conditions since late January; an area of extreme (D3) drought in far western Colorado and eastern Utah was upgraded to D2, and a nearby area of D2 in southwestern Colorado and southeastern Utah was upgraded to D1. But the great majority of the region is still classified in severe (D2) or worse drought: Colorado, 89% (down from 100%); Wyoming, 84% (down from 86%); and Utah, 52% (down from 66%).
Current Snowpack and Streamflows
The distribution of precipitation in February tended to reduce the disparity among the region’s basin snowpacks by March 1, with the basins that had been the driest (eastern Colorado and eastern Wyoming) seeing gains and those that had been the wettest (most of Utah, and northwestern Wyoming) seeing losses compared to the average conditions. In Colorado, February brought mainly near-average accumulations, so that March 1 snowpack values, at 65–80% of average, were similar to the February 1 values, with slight declines in the southwestern basins and increases east of the Continental Divide. In Wyoming, the western portion of the state saw below-average accumulation and March 1 snowpack levels declined significantly, to 79–91% of average. Across the rest of the Wyoming, March 1 snowpack values were generally improved, if slightly, compared with February 1. In Utah, however, all basins saw below-average accumulation, leading to March 1 snowpack values that were significantly lower than February 1, at 73–96% of average. Overall, nearly all basins in the region have below-average March 1 snowpacks.
In the maps of current streamflows across the three states, many gages are still ice-affected and not reporting, especially in Wyoming. Of the gages that are reporting, the “normal” category is most frequently reported, but there are many more gages in the below-normal categories than above-normal, particularly in Colorado. The Green River near Greendale, UT gage, was in the 20th percentile, at 75% of the median flow for March 5. The Colorado River near the CO-UT State Line was in the 19th percentile, at 70% of the median flow for March 5.
Spring-Summer Streamflow Forecasts
The March 1 spring-summer streamflow forecasts of the season were just released by NOAA CBRFC and the NRCS. The NRCS Westwide Streamflow Forecast Map shows that most basins in our region are now expected to have much-below-average (50-69%) spring and summer runoff, with basins in central and southwestern Utah and northern Wyoming being in relatively better shape with forecasted below-average (70-89%) or near-average (90-109%) runoff. Several basins have slipped to the far-below-average category (25-49%) category, including overall Lake Powell inflows; the official CBRFC March 1 forecast has been reduced to 3.4 MAF, only 49% of average, compared to the February 1 forecast of 3.85 MAF. The very dry runoff outlook for the region reflects both the below-average snowpacks and the unusually dry soil moisture last fall, which is expected to significantly reduce runoff efficiency in the spring. (NOTE: While NRCS and NOAA continue to collaborate on streamflow forecasts, the forecast values are no longer being strictly coordinated between NRCS and some of the RFCs, including the CBRFC.)
Seasonal Climate and Drought Forecasts
The latest monthly Climate Outlooks for March, released on February 28 by NOAA CPC, show no tilt for precipitation for our region for March, except for the extreme southwestern corner of Utah, and a tilt towards colder-than-average conditions for March over the region, especially Wyoming. The latest seasonal Climate Outlooks released on February 21 by NOAA CPC show a tilt towards drier-than-average conditions spring and early summer across most of the region, with the area of dry tilt covering more of the region than last month’s outlooks for spring. The CPC Climate Outlooks continue to show enhanced odds for above-normal temperatures for the winter and spring seasons for at least Utah and Colorado, consistent with the long-term trend towards warmer conditions. The latest CPC Seasonal Drought Outlook released February 21 projects that the drought conditions across our region will persist, through at least May 2013, and as seen in the previous outlook, some improvement is expected in far northern Wyoming.
The latest PSD Precipitation Forecast Guidance ("SWcast"), released March 5 for April–June 2013 conditions, forecasts a wet tilt for spring and early summer for all of Colorado and much of Utah, with the strongest tilt towards wet conditions (>10%) over western and south-central Colorado and far eastern Utah. A modest tilt towards dry conditions is forecasted for far northern Utah. (We will try to update soon with more explanation of the SWcast and why it might differ from the CPC forecast.)
As has been the case since fall 2012, ENSO conditions are not exerting much influence on the climate system, and thus the seasonal forecasts. ENSO indicators continue to show ENSO-neutral conditions on the cool (La Niña) side of neutral. The models in IRI's mid-February ENSO Prediction Plume indicate a consensus towards ENSO-neutral conditions continuing through next summer and fall.
February 4, 2013 (updated February 6 and 7)
Highlights
-
January precipitation was patchily distributed across the region; western Colorado, southeastern Utah, and north-central Wyoming ended up wetter than average, with most other areas drier than average
-
After storms in the last week of January roughly balanced out dry conditions the rest of the month, snowpacks remain below average across Colorado and southeast Wyoming, and near or above average in Utah and the rest of Wyoming
-
The January 1 forecasts for spring-summer streamflow call for below-average flows in nearly all basins in the region; the February 1 forecasts that have been released thus far show a similarly dry outlook
-
The NOAA CPC seasonal climate outlooks, as well as the “SWcast”, continue to show a slight dry "tilt" for late winter and spring precipitation for the southern half of our region, but the one-month outlook for February has a wet tilt based largely on the storms forecasted for the next week
January Precipitation and Temperatures, and Current Drought
January saw a very uneven distribution of precipitation across our region, in both space and time. The first three weeks of January were quite dry, with two systems in the last week generating most of the month’s moisture. Most mountain areas in western and central Colorado ended up with above-average precipitation, as did eastern Utah and north-central Wyoming. Drier-than-average conditions predominated in southern Wyoming and, yet again, in eastern Colorado. The HPRCC Water Year Precipitation map shows that while January aided some areas, most of the region remains drier than average since October 1. Southeastern Colorado is still the driest area in the region, with less than 50% of average October–January precipitation.
Perhaps the most notable aspect of January’s weather was the cold anomaly over most of Utah and portions of western Colorado, with monthly temperatures more than 10°F below average. Intrusions of Arctic air were followed by upper-level ridging and calm winds, leading to persistent surface inversions. Moab, Utah ended up with a record-cold January monthly average of 8.6°F, or 18°F below normal, and more than 5°F below the previous record. In northern Utah, a particularly strong inversion caused a serious air pollution episode from about the 18th to the 26th.
The latest US Drought Monitor, representing conditions as of January 29, shows very little change in drought conditions since January 1. The vast majority of the region is still classified in severe (D2) or worse drought: Colorado, 100% (up from 95%); Wyoming, 86% (unchanged), and Utah, 66% (up from 64%).
Current Snowpack and Streamflows
The dry first three weeks of January saw regional snowpacks decline with respect to the typical trajectory—especially in Colorado, where this slippage was dramatic. But the final, snowy, week salvaged the month for most basins, bringing conditions close to where they were on January 1 in terms of percent of average. The NRCS Current Basin Snowpack map on February 1 showed that Colorado and southeastern Wyoming basins remain well below to below average, with the South Platte and Arkansas near record-low levels at about 60% of average. In the rest of Wyoming and in Utah, snowpacks are generally near-average or slightly above average. In Utah’s Wasatch Range, the mountain snowpack slipped to about 85% of average even as the urban areas and foothills experienced above-average snowfall, thanks to “upside-down” storms. The February 1 basinwide snowpack for the Upper Colorado River above Lake Powell was 84% of average, compared to 86% of average on January 1.
In the maps of current streamflows in the three states, most gages are ice-affected and not reporting, as is normal for this time of year. The Green River near Greendale, UT gage, was in the 40th percentile, at 81% of the median flow for February 1.
Spring-Summer Streamflow Forecasts
See the previous briefing for details of the January 1 streamflow forecasts for spring–summer 2013. The general outlook for the region is drier than average, reflecting the snowpack anomalies. The next (February 1) streamflow forecast map should be posted by NRCS (and on the Dashboard) around February 10th; we expect no major changes in the regional outlook from the January 1 forecasts. The Colorado Basin River Forecast Center (CBRFC) has released their official February 1 forecasts here; there are slight improvements in the forecasted flows for the San Juan and Uncompahgre basins compared with January 1, but the forecasts are generally lower than on January 1 elsewhere in the Upper Colorado Basin and eastern Great Basin. The official CBRFC February 1 forecast for April–July Lake Powell inflows has slipped to 3.85 MAF, only 54% of average, compared to the January 1 forecast of 4.4 MAF. (NOTE: While NRCS and NOAA continue to collaborate on streamflow forecasts, the forecast values are no longer being strictly coordinated between NRCS and some of the RFCs, including the CBRFC.)
Seasonal Climate and Drought Forecasts
The latest monthly Climate Outlooks for February, released on January 31 by NOAA CPC, shows a wet tilt for most of Utah and western Colorado through February, reflecting the weather model guidance showing a tendency towards troughs (= moisture) over that area in the first half of February. It is also consistent with the wet forecast for our region seen in the 5-day QPF for the February 6–11 period. The latest seasonal Climate Outlooks released on January 17 by NOAA CPC continue to show a slight tilt towards drier-than-average conditions for the late winter and spring in the southern portion of our region, with the area of dry tilt covering more of Colorado and Utah than the previous outlooks. The CPC Climate Outlooks continue to show enhanced odds for above-normal temperatures for the winter and spring seasons, consistent with the long-term trend towards warmer conditions. The latest CPC Seasonal Drought Outlook released January 17 projects that the drought conditions across our region will persist, through at least April 2013, with a slight change from previous outlooks, in that some improvement is expected in far northern Wyoming.
The latest PSD Precipitation Forecast Guidance ("SWcast"), released January 23 for January–March 2013 conditions, continues to forecasts a dry tilt in late winter for most of Utah and Colorado, with the strongest tilt towards dry conditions (>10%) in north-central Colorado—though the model skill is marginal in northern Colorado for this season. A modest tilt towards wet conditions is forecasted for far northern Utah. Overall, this dry outlook for Utah and Colorado is mostly unchanged from the forecast made in November, and is consistent with a continued cold North Pacific (PDO-) in conjunction with a warm North Atlantic (AMO+).
As has been the case since last fall, the seasonal forecasts are not being influenced by ENSO, since the ENSO indicators continue to show ENSO-neutral conditions—though tipping most recently towards La Niña conditions—and the models in IRI's mid-January ENSO Prediction Plume show a consensus towards ENSO-neutral conditions continuing through next summer.
January 23, 2013
(see addition January 25, at bottom)
Current Snowpack
After strong gains in December, an extended stretch of drier-than-normal weather across the region since January 1 has caused snowpacks to slip backwards with respect to average conditions, especially in Colorado and eastern Wyoming. The Current Basin Snowpack map from NRCS shows Colorado basin snowpacks ranging from 55–68% of average, and mainly from 30–70% of average in eastern Wyoming. In Utah and western Wyoming, nearly all basins have between 80–100% of average snowpack. The basinwide snowpack for the Upper Colorado River above Lake Powell as of January 23 is at 71% of average, down sharply from 86% of average on January 1.
Spring-Summer Streamflow Forecasts
The first spring-summer streamflow forecasts of the season, valid January 1, were released by NOAA CBRFC and the NRCS in early January. The NRCS Westwide Streamflow Forecast Map shows most basins in our region expected to have below-average (70-89%) or much-below-average (50-69%) spring and summer runoff, with several basins expected to have near-average (90-109%) runoff in central Utah and northwestern Wyoming. IMPORTANT NOTE: While NRCS and NOAA continue to collaborate on streamflow forecasts, the forecast values are no longer being strictly coordinated between NRCS and some of the RFCs, including the CBRFC. For example, the NOAA CBRFC January 1 forecast for Lake Powell April-July inflows is 4400 KAF, 61% of average. The NRCS forecast for the same point is for 4000 KAF, 56% of average. Also note that all of the January 1 forecasts do not reflect the declines in snowpack since the first of the month.
Seasonal Climate and Drought Forecasts
The latest monthly and seasonal Climate Outlooks released on January 17 by NOAA CPC continue to show a slight tilt towards drier-than-average conditions for the late winter and spring in the southern portion of our region, with the area of dry tilt covering more of Colorado and Utah than the previous outlooks. The CPC Climate Outlooks continue to show enhanced odds for above-normal temperatures for the winter and spring seasons, consistent with the long-term trend towards warmer conditions. The latest CPC Seasonal Drought Outlook released January 17 projects that the drought conditions across our region will persist, through at least April 2013, with a slight change from previous outlooks, in that some improvement is expected in far northern Wyoming.
[Added January 25:] The latest PSD Precipitation Forecast Guidance ("SWcast"), released January 23 for January–March 2013 conditions, continues to forecasts a dry tilt in late winter for most of Utah and Colorado, with the strongest tilt towards dry conditions (>10%) in north-central Colorado—though the model skill is marginal in northern Colorado for this season. A modest tilt towards wet conditions is forecasted for far northern Utah. Overall, this dry outlook for Utah and Colorado is mostly unchanged from the forecast made in November, and is consistent with a continued cold North Pacific (PDO-) in conjunction with a warm North Atlantic (AMO+).
January 3, 2013
Highlights
-
December was generally wetter than average west of the Continental Divide, but mostly drier than average to the east
-
Snowpack conditions improved in December but remain below-average across Colorado and in parts of Wyoming; snowpacks are near- or above-average in Utah and most of Wyoming
-
The NOAA CPC climate outlooks now show a slight dry "tilt" for winter and early spring precipitation for the southern half of our region
December Precipitation and Temperatures, and Current Drought
December was wetter overall in our region than November and October, with most mountain regions seeing above-average precipitation for the month, including western and central Colorado, western Wyoming, and far northern Utah. There were also large areas with drier-than-average conditions, especially eastern Wyoming and most of eastern Colorado. Despite the December gains in many areas, the HPRCC Water Year Precipitation map shows that after the first quarter of the 2013 water year, nearly all of the region is drier than average, with some areas like southeastern Colorado seeing less than 50% of average October–December precipitation. December was cooler than average over most of the region, with the wetter areas generally seeing the below-average temperatures, and the drier parts of Wyoming and Utah being warmer than average. The latest US Drought Monitor, representing conditions as of January 1, shows a modest reduction in the area of severe (D2) and extreme (D3) drought conditions since late November, but the vast majority of the region is still classified in severe (D2) or worse drought: Colorado, 95%; Wyoming, 86%, and Utah, 66%.
Current Snowpack and Streamflows
As reported in the December 21 briefing, snowpacks across Colorado saw large gains in December. Even so, the NRCS Current Basin Snowpack map shows that Colorado—and southeastern and north-central Wyoming—still lag well behind average conditions for early January. In the rest of Wyoming and in Utah, snowpacks kept pace with normal accumulations during December and are near-average or slightly above average. The January 1 basinwide snowpack for the Upper Colorado River above Lake Powell was 86% of average, up sharply from 60% of average on December 1.
In the maps of current streamflows in the three states, note that most gages are now ice-affected and not reporting, as is normal for this time of year. The gages that are reporting are mostly showing normal (green) streamflows, below-normal (yellow), or much-below normal (brown) flows for the date, with very few in the above-normal categories. The Colorado River near Cisco, UT gage, was in the 13th percentile, at 76% of the median flow for December 2.
Seasonal Climate and Drought Forecasts
As reported in the December 21 briefing, the latest monthly and seasonal Climate Outlooks released on December 20 by NOAA CPC are now showing a slight tilt towards drier-than-average conditions for the winter and early spring in the southern portion of our region. The IRI's mid-December ENSO Prediction Plume shows a strong model consensus that ENSO-neutral conditions will continue through next spring, and only a slight chance of an El Niño or La Niña event emerging in that time frame. The CPC Climate Outlooks continue to show enhanced odds for above-normal temperatures for the winter and early spring season, consistent with the long-term trend towards warmer conditions. The latest CPC Seasonal Drought Outlook released January 3 once again projects that the drought conditions across our region will persist, through at least March 2013.
December 21, 2012
Current Snowpack
More favorable storm tracks since December 1 have led to widespread increases in the snowpack across the region, with the most dramatic gains being seen in Colorado and eastern Utah. The Current Basin Snowpack map from NRCS shows Colorado basin snowpacks ranging from 58–81% of average, compared to 30–50% as of December 1. Utah basin snowpacks are all near or above average, while Wyoming basin snowpacks are near or above average except in the southeast corner of the state, where they are below average. The basinwide snowpack for the Upper Colorado River above Lake Powell as of December 21 is at 86% of average, up from 60% of average on December 1.
Seasonal Climate and Drought Forecasts
The latest monthly and seasonal Climate Outlooks released on December 20 by NOAA CPC are now showing a slight tilt towards drier-than-average conditions for the winter and early spring in the southern portion of our region. The CPC Climate Outlooks continue to show enhanced odds for above-normal temperatures for the winter season, consistent with the long-term trend towards warmer conditions. The latest CPC Seasonal Drought Outlook released December 20 again projects that the drought conditions across our region will persist, through at least March 2013.
December 3, 2012
Highlights
-
November, like October, was drier than average for most of the region, and the 2013 water year is off to a dry start
-
Early-season snowpack is extremely low across Colorado and eastern Utah, but generally near-average for other parts of Utah, and Wyoming
-
The official NOAA CPC climate outlooks show no "tilt" for this winter's precipitation for our region; the NOAA PSD forecast guidance has a drier outlook
November Precipitation and Temperatures, and Current Drought
November was again much drier than average across most of the region. Most of eastern and central Colorado, southeast Wyoming, and eastern Utah saw less than 25% of average precipitation for the month. Conditions were wetter-than-average in north-central and southwest Wyoming and portions of northern Utah. According to the HPRCC Water Year Precipitation map, the first two months of the 2013 water year have left nearly all of the region drier than average, with most of Colorado and eastern Utah seeing less than 50% of average October–November precipitation. November was also a warm month, with temperatures 2° to 6°F above average over most of the region and up to 10°F above average in south-central Wyoming. The latest US Drought Monitor, representing conditions as of November 27, shows nearly all of the region still classified in severe (D2) or worse drought conditions. There was little change in the drought conditions across the region during November; a small pocket of D1 in north-central Colorado worsened to D2.
Current Snowpack and Streamflows
We are now far enough into the snow season (on average, 20-25% of seasonal accumulation occurs by December 1) that the percent-of-average data reported in the Current Basin Snowpack map from NRCS reliably reflect conditions on the ground. The regional snowpack map shows a pronounced difference between the generally near-average conditions in Wyoming and Utah, and the very low snowpacks in far eastern Utah and across Colorado. The Colorado statewide snowpack as of December 1 was around 40% of average, which is near the lowest level recorded since the mid-1980s. (Of the six years since 1986 with similarly low early-season snowpack across Colorado, two years (2008 and 2009) rebounded to above-average snowpacks by April 1, while one (2010) recovered to near-average conditions, and the remaining three remained well below average through the spring, including 2000 and 2002.) The December 1 basinwide snowpack for the Upper Colorado River above Lake Powell was about 60% of average.
Current streamflows in the three states reflect the gradient in recent precipitation and snowpack, with Wyoming gages generally reporting normal (green) streamflows for the date, with more gages in the below-normal (yellow) and much-below normal (brown) categories in Utah, and yet more in Colorado. The Colorado River near Cisco, UT gage, was in the 13th percentile, at 76% of the median flow for December 2.
Seasonal Climate and Drought Forecasts
As reported in the previous briefing, the latest monthly and seasonal Climate Outlooks released on November 15 by NOAA CPC are showing equal chances (EC) for above-normal or below-normal precipitation for the December through March period, with this lack of "tilt" reflecting the strong likelihood of ENSO-neutral conditions continuing through this period, as seen in the IRI's mid-November ENSO Prediction Plume. If this occurs, it will be the first ENSO-neutral winter since 2003-04. The CPC Climate Outlooks continue to show enhanced odds for above-normal temperatures for the winter season, consistent with the long-term trend towards warmer conditions. The latest CPC Seasonal Drought Outlook released November 15 projects that the drought conditions across our region will persist through at least February 2013.
The latest PSD Precipitation Forecast Guidance ("SWcast"), released November 19 for January–March 2013 conditions does find a signal in the pattern of past years with similar ocean-atmosphere conditions, apart from ENSO, and forecasts a dry tilt over that period for most of Utah and Colorado, with the strongest tilt towards dry conditions (>10%) in north-central Colorado—though the model skill is marginal in northern Colorado for this season and lead-time. A modest tilt towards wet conditions is forecasted for far northern Utah. Overall, this is a drier outlook for Utah and Colorado than the January–March forecast issued in late September, due to the now lower (almost zero) probability of El Niño while still having a warm North Atlantic Ocean and cold eastern North Pacific Ocean.
November 15, 2012
The latest monthly and seasonal Climate Outlooks released today (November 15) by NOAA CPC look very similar to those earlier this fall, showing equal chances (EC) for above-normal or below-normal precipitation for the December through March period. This lack of "tilt" for our region reflects that ENSO indicators in the tropical Pacific such as Nino 3.4 sea surface temperatures, after briefly flirting with El Niño, have returned to neutral conditions, and the vast majority of ENSO forecast models compiled for IRI's mid-November ENSO Prediction Plume call for ENSO-neutral conditions to continue through the winter. The CPC Climate Outlooks continue to show enhanced odds for above-normal temperatures for the winter season, consistent with the long-term trend towards warmer conditions. The latest CPC Seasonal Drought Outlook, also released November 15, projects that the drought conditions across our region will persist through February.
November 6, 2012
October saw the dryness of the 2012 water year continue, with nearly all of the region drier than average since October 1 except for scattered areas in southern and western Wyoming and extreme northeast Utah, according to the HPRCC Water Year Precipitation map. Portions of northwest Colorado, southern Colorado, and central and southern Utah saw less than 25% of average precipitation for the month. The latest US Drought Monitor, released November 1, shows nearly all of the region still classified in severe (D2) or worse drought conditions. There was little change in the drought conditions across the region during September.
We are still very early in the snow season, and the long-term average SWE for November 6 at many SNOTEL sites is less than 1". Thus the percent-of-average data reported in the Current Basin Snowpack map from NRCS may not be a reliable measure of conditions. That said, examining only reports from the high-elevation/high-accumulation SNOTEL sites confirms the impression from the map that the snowpack is above-average in northern Utah, and generally below average in the rest of the region, with Colorado basins being well below average except in the north-central mountains.
Compared to early October, there are now more stream gages across the three states reporting below-normal (yellow) and much-below normal (brown) current streamflows, especially in western Colorado and northern and eastern Utah. Four gages in Colorado and one in Wyoming are showing record-low flows for the date (November 5).
The latest monthly and seasonal Climate Outlooks released on October 18 by NOAA CPC continue to show equal chances (EC) for above-normal or below-normal precipitation for the October through January period, reflecting the likelihood of either ENSO-neutral or weak El Niño conditions during this period, as seen in the IRI's mid-October ENSO Prediction Plume. The CPC Climate Outlooks continue to show enhanced odds for above-normal temperatures, consistent with the long-term trend towards warmer conditions. [The preceding text is unchanged from the October 23 briefing]. The latest CPC Seasonal Drought Outlook released November 1 projects that the drought conditions across our region will persist through at least January 2013.
October 23, 2012
The latest monthly and seasonal Climate Outlooks released on October 18 by NOAA CPC continue to show equal chances (EC) for above-normal or below-normal precipitation for the October through January period, reflecting the likelihood of either ENSO-neutral or weak El Niño conditions during this period, as seen in the IRI's mid-October ENSO Prediction Plume. The CPC Climate Outlooks continue to show enhanced odds for above-normal temperatures, consistent with the long-term trend towards warmer conditions. The latest CPC Seasonal Drought Outlook also released October 18 projects that the drought conditions across our region will persist through at least December.
Thus far in October (and the beginning of the 2013 water year), according to the HPRCC Water Year Precipitation map, precipitation has been well below-average across the region except for small areas in north-central Colorado and southwestern Utah. Over the next 4-5 days a storm system is forecasted to bring significant precipitation to northern and eastern Colorado, northern Utah, and much of Wyoming.
As of October 23, the Current Basin Snowpack map from NRCS shows a misleading picture for Utah as there are are actually very few SNOTEL sites in that state, and across the region, reporting any SWE on the ground. [Correction 10/24: The deleted wording did not distinguish sites that were not reporting any data from sites that were reporting zero SWE. And more sites are now reporting data on 10/24, compared to the previous day. See this SNOTEL map from NRCS for a clearer depicton of current site-level data across the West.] Most SNOTEL sites across the region are reporting below-average precipitation since October 1, consistent with the HPRCC precipitation map, which does not include SNOTEL data.
October 1, 2012
September was drier than average across Wyoming, western Colorado, and much of Utah. Wetter-than-average conditions prevailed in central Colorado, far western Utah, and other parts of Utah. Over the just-completed 2012 water year, nearly all of the region was drier than average, with about half the region receiving less than 70% of average precipitation. The latest US Drought Monitor reflects the widespread long-term dryness, with nearly all of the region mired in severe (D2) or worse drought conditions, including small areas of D4 in far northeastern and southeastern Colorado.
The very first snowpack accumulations of the season are being reported by the SNOTEL network. The majority of stream gages reporting across the three states have flows in the normal range, but with many gages at below-normal and much-below normal flows also scattered throughout the region.
The latest monthly and seasonal Climate Outlooks from NOAA CPC show equal chances (EQ) for above-normal or below-normal precipitation for the October through January period, and enhanced odds for above-normal temperatures during that period, consistent with the long-term trend towards warmer conditions. The latest CPC Seasonal Drought Outlook projects that the drought conditions across our region will persist through at least December. The latest experimental precipitation forecast guidance from NOAA ESRL PSD shows enhanced chances for wetter-than-average conditions in eastern Colorado for the October-December period.
This summer, conditions in the tropical Pacific appeared to be in a rapid transition to El Nino, but that transition has slowed in the past month, and NOAA has not yet announced an El Nino. The most recent ensemble of ENSO prediction models forecasts that conditions will either remain on the warm side of ENSO-neutral, or transition to weak El Niño conditions through the winter season.