 |
|
|
|
 |
FROM ice ages to long warming periods, Earth’s climate has changed, often drastically, during the planet’s history. Human activities associated with burning fossil fuels for transportation, manufacturing, and energy production have dramatically altered the composition of the atmosphere, which ultimately may modify long-term climactic trends.
For more than two decades, Lawrence Livermore has been a leader in advancing scientific understanding of the causes and consequences of climate change, developing strategies to mitigate the risks, and strengthening computational tools used to predict future patterns. Accurate predictions are essential because long-term climate changes have the potential to significantly affect human health, crop yields, pest management, fire danger, water quality and supply, and many other factors related to socioeconomic well-being.
Livermore’s Center for Accelerator Mass Spectrometry (CAMS) has become a valuable resource for climate scientists by providing high-fidelity historical data to improve long-term predictions. In particular, CAMS is revealing details about Earth’s carbon cycle, the flow of carbon atoms through the planet’s living organisms, oceans, atmosphere, and soil. At CAMS, researchers can precisely measure the ratio of radiocarbon (the unstable carbon-14 isotope) to stable carbon (carbon-12). Radiocarbon is naturally produced by the interaction of cosmic rays and air and is present at low levels in the atmosphere and food. By dating samples and characterizing their material components, scientists can examine how climate variations affected the carbon cycle and how past ecosystems reacted to significant changes. (See the box below.)
Climate change is a variation in the statistical distribution of weather patterns over periods ranging from tens to millions of years. “It can be a change in the average weather or a change in the distribution of weather events around an average,” says CAMS Director Graham Bench. “Climate change may be limited to a specific region, or it may occur across the whole Earth.” Accurate predictions help policy makers evaluate potential responses to projected scenarios. Predicting a long-term increase in precipitation, for example, tells only part of the story. Precipitation falling as rain instead of snow could be disastrous for a state such as California, which depends on its snowpack for water storage. Likewise, precipitation that falls evenly over several months usually causes much less havoc than a few potentially flood-causing storms, even when the total rainfall is equal.
Climate change research at CAMS is led by the Natural Carbon Group, headed by Livermore geochemist Tom Guilderson. Members of the group and its dozens of collaborators worldwide use radiocarbon measurements as an easily identifiable tracer to measure geologic time and to follow the path of carbon flow.
The group’s research focuses both on understanding how carbon dioxide (CO2) enters and leaves the atmosphere, oceans, and terrestrial biosphere and on acquiring climate records from the past to examine the processes governing current and future climate patterns. Research activities include studying corals to document changes in ocean circulation, determining the uptake and storage of carbon in soils, mapping the decades- to centuries-long droughts in California, studying the exchange of CO2 between the atmosphere and oceans, and calculating carbon uptake by different ecosystems. The group works closely with the international scientific community and with the Department of Energy’s Program for Climate Model Diagnosis and Intercomparison, which was established in 1989 at Lawrence Livermore to analyze current climate models.
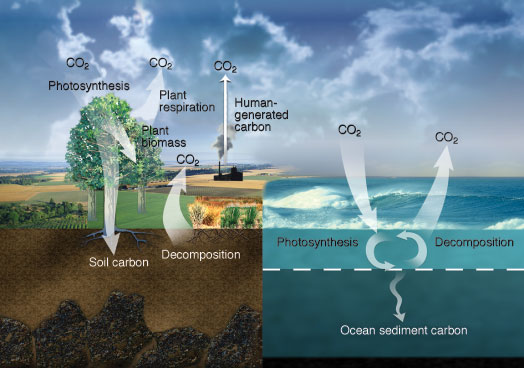 |
| In Earth’s carbon cycle, photosynthesis removes carbon dioxide (CO2) from the atmosphere. Respiration from plants and soil microbes and the decomposition of biological material returns CO2 to the atmosphere, as do human activities, mainly from burning fossil fuels. Oceans absorb and release carbon primarily via diffusion across the air–ocean interface. Phytoplankton photosynthesis converts CO2 into organic carbon that is largely returned to ocean water as CO2 via microbial respiration and decomposition. A small amount of organic carbon sinks to the ocean floor. (Courtesy of the Department of Energy Office of Science.) |
Warming May Not Increase Fires
One major concern for climate scientists is that rising temperatures could make many regions drier and hence elevate the risk of forest fires. Research by Livermore scientist Tom Brown and colleagues is showing that nature’s response to higher temperatures may instead counteract the heat effects and reduce the projected fire risks. To study climate effects on fire frequency, Brown worked with Philip Higuera of Montana State University and colleagues at the University of Washington and the University of Illinois to analyze sediment cores extracted from lake bottoms in the Brooks Range of northern Alaska.
The scientists recorded the types and abundance of preserved plant parts, such as microscopic pollen grains, from 15,000 years ago to the present. At CAMS, they radiocarbon-dated organic deposits in the sediment. They also looked for charcoal particles in the samples to determine how frequently forest fires occurred. Next, they compared the fire frequency data to the kinds of vegetation that were dominant during various periods and considered those findings in terms of what is known about past climate patterns in northern Alaska. Results indicated that, contrary to conventional thinking, the number of fires decreased during warmer periods. In fact, the researchers found that historically, fire frequency coincided more with the type of vegetation than with temperature.
For example, about 10,500 years ago, northern Alaska’s climate changed from cool and dry to warm and dry, which would suggest a higher incidence of fires. However, sediment cores revealed that during this period vegetation changed from flammable shrubs to fire-resistant deciduous trees. As a result, the frequency of fires declined sharply. About 5,000 years ago, the area became cooler and wetter, conditions that would suggest a decrease in fires. However, the scientists found evidence of more frequent fires, which they attributed to the growth of highly flammable spruce forests in the region.
According to Brown, many climate models show that warmer temperatures decrease moisture and increase ignition rates. However, the CAMS results indicate that the type of vegetation can significantly alter the direct link between climate and fire. “Vegetation can have a profound impact on fire occurrences, independent of climate’s influence,” says Brown. “Models that consider rising temperatures while ignoring vegetation will not accurately predict the likelihood of wildfires in a particular region. We have to look at the whole picture.”
In an earlier study, Brown measured carbon storage in the 6.2-million-square-kilometer Amazon River Basin, where each year, vegetation and soil absorb millions of tons of CO2 through the process of photosynthesis. Determining how long an ecosystem such as a tropical rain forest stores atmospheric CO2 is important because some scientists have suggested that such ecosystems might serve as long-term storage sites of atmospheric CO2. However, radiocarbon measurements showed that the basin stores carbon for only about five years before returning it to the atmosphere as CO2. (See S&TR, March 2006, Carbon Goes Full Circle in the Amazon.)
 |
In the south-central region of the Brooks Range, Alaska, researchers are determining the historical relationship between climate, vegetation, and the incidence of fires. (Courtesy of Philip Higuera.) |
 |
Researchers collect sediment cores from a lake in the Brooks Range of Alaska. (Courtesy of Philip Higuera.) |
|

Using the Radiocarbon Pulse
In recent decades, scientists have studied the growing amount of CO2 emitted to the atmosphere from human activities and its relationship to the slow but steady rise in average planetary temperature. Globally, more carbon (contained in many different organic compounds) is stored as soil organic matter than in vegetation and the atmosphere combined. Despite their importance to climate, soils are a poorly understood aspect of the terrestrial carbon cycle.
Because trees capture so much of the atmosphere’s CO2, predicting the amount of carbon that might be retained by forests provides important information. A significant portion of this carbon is sequestered for decades to centuries in the trunks and large branches of trees. Much of the carbon consumed as CO2 is later shed in leaves, twigs, and small roots. As these components decompose, they release carbon to the soil and eventually back to the atmosphere.
Determining the rates of carbon transfer between plants and soil and back to the atmosphere is important for improving carbon cycle models and determining if CO2 produced by human activities can be sequestered in terrestrial ecosystems, such as forests. To better understand this cycle, environmental scientist Karis McFarlane has been taking advantage of a large, unplanned release of innocuous radiocarbon-labeled CO2 from incinerators near Oak Ridge, Tennessee, in 1999. Trees in a nearby hardwood forest incorporated the released CO2 into leaf, stem, and root tissue, which eventually became leaf and root litter. This “pulse” of a rare isotope in an ecosystem presented a unique opportunity for studying how carbon is incorporated into the soil of a temperate forest, how long it resides there, and what causes it to reemerge into the atmosphere.
The research, which has involved analyzing thousands of soil samples at CAMS, is part of the Department of Energy’s Enriched Background Isotope Study. This project is aimed at improving the ability to model the accumulation and fate of carbon within organic and mineral soils and thus better understand the carbon cycle in the deciduous forests that comprise 46,000 to 60,000 square kilometers of North America east of the Mississippi River. The radiocarbon-pulse study includes researchers from Oak Ridge, Argonne, and Lawrence Berkeley national laboratories; the U.S. Forest Service; and the University of California.
As part of the isotope study, scientists collected leaf litter and dug up small roots from radiocarbon-enriched trees at Oak Ridge and transferred them to four research forests in New Hampshire, Massachusetts, northern Michigan, and Missouri. Every year, McFarlane takes samples from each of the four forests and measures the radiocarbon levels to study the contribution of leaf versus root litter to the carbon accumulation in soil and the transport rate of carbon into mineral soil storage. She first separates the soil organic matter into three different fractions based on their density: light-density plant organic matter; physically protected soil organic matter; and heavy, mineral-rich fractions. She then measures the radiocarbon concentration of each fraction.
Results from the first six years of the Oak Ridge study show that carbon in the top, leaf-litter layer is respired as CO2 by microbes and is not being transported into the mineral soil where it might be protected and sequestered for decades or centuries. “New carbon from leaves makes it only into the top couple of centimeters in soil over several years,” says McFarlane. “Below this level, tree roots are providing new carbon to soil, meaning that roots are more important sources for carbon in soil than previously realized.”
Data from the four forests provided new information as well. “We know that carbon stays around longer in cold climates because microbial activity is limited,” says McFarlane. “We are finding that soil characteristics also affect carbon storage. They are an important consideration for developing carbon models that can improve our ability to predict future climate.”
 |
In 1999, trees in a hardwood forest near Oak Ridge, Tennessee, incorporated a pulse of radiocarbon-labeled CO2, which eventually became leaf and root litter. By analyzing soil organic matter from this forest, researchers are determining how carbon is incorporated into the soil of temperate forests, how long it resides there, and what causes it to reemerge into the atmosphere. (Courtesy of Paul Hanson, Oak Ridge National Laboratory.) |
 |
Radiocarbon studies at the Center for Accelerator Mass Spectrometry show that carbon from fallen leaves at Oak Ridge forests is respired as CO2 by microbes and is not transported into the deeper mineral soil where it might be sequestered for many years. However, decaying tree roots are providing carbon to deeper soil layers. |
Ocean Currents Key to CO2 Levels
Studies performed at CAMS have helped pioneer the application of large radiocarbon data sets in determining past ocean circulation patterns. Ocean currents transport enormous quantities of heat and thus play a crucial but poorly documented role in Earth’s climate. In addition, ocean circulation controls the sequestration of CO2 in the deep sea on millennial timescales.
As part of a research collaboration, Guilderson is making radiocarbon measurements at CAMS to trace the pathway of a large amount of CO2 released from the deep ocean to the atmosphere at the end of the last ice age, about 10,000 years ago. Funded by the National Science Foundation, this project includes researchers from the University of California at Davis and Santa Cruz, Rutgers University, Institut de Ciència i Technologia Ambientals in Spain, University of Auckland in New Zealand, and Woods Hole Oceanographic Institution.
The team took sediment cores from the area surrounding Antarctica and the South Pacific Ocean near New Zealand and dated the samples to between 13,000 and 19,000 years old. The radiocarbon in the cores served as a tracer showing when the large CO2 release occurred and the ocean pathway by which it escaped. A rapid increase in atmospheric CO2 concentrations during this period coincided with a reduced amount of radiocarbon in the atmosphere, suggesting that a release of very “old” carbon—or CO2 with a low ratio of radiocarbon to stable carbon—from the deep ocean to the atmosphere occurred at the end of the last ice age.
Some scientists have wondered whether deeper waters, which are substantially depleted in radiocarbon, were drawn to the upper ocean layers near Antarctica and served as the main source of the CO2 release that sped up the melting of glaciers. Analysis of cores taken from the ocean floor near New Zealand suggests that if the old, low-radiocarbon water upwelled near Antarctica, it remained at the surface long enough to nearly equilibrate with the atmosphere. However, the expected low-radiocarbon signal that would be transported from the surface back into intermediate-depth waters is absent in the New Zealand data. An alternative interpretation is that the low-radiocarbon signal outcropped elsewhere, with a likely candidate the far northern region of the Pacific Ocean.
Guilderson notes that the CO2 release from the last ice age is not relevant to recent global warming because the average lifetime of CO2 in the atmosphere is about 70 to 100 years. “When we radiocarbon-dated CO2 in the atmosphere,” says Guilderson, “the isotopic signature we found indicated that this accumulation is mainly due to the use of fossil fuels.”
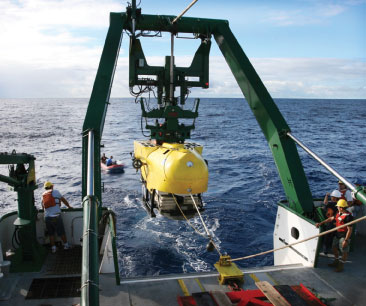 |
A deep-sea research submersible is used to retrieve coral samples off the coast of Hawaii. (Courtesy of Robert Dunbar, Stanford University.) |
 |
Long-living Leiopathes sp., or deep-water black coral (top), and Geradia sp., or gold coral (bottom), provide a storehouse of knowledge on changes in ocean conditions and climate. (Courtesy of National Oceanic and Atmospheric Administration Hawaii Undersea Research Laboratory.) |
Corals as Data Repositories
Guilderson has also been studying reef-building (surface) and deep-sea corals. Reef-building corals are found in warm, shallow tropical locations. Deep-sea corals grow at depths from 300 to more than 3,000 meters and are ubiquitous throughout the world’s oceans. These two types of corals lend themselves to radiocarbon-dating studies because their massive calcium carbonate skeletons are accreted nearly continuously, and the colonies can live for thousands of years. The growth of coral colonies is affected by changes in ocean conditions such as acidity and temperature. “We’re using surface corals as our thermometers and rain gauges” says Guilderson. “Reef-building corals are repositories for a lot of information that can give us a long-term perspective on ocean currents and hence climate variability for locations and times when people weren’t making observations.”
With the help of CAMS, researchers are looking at isotopes of carbon, oxygen, and nitrogen to obtain water temperature, salinity, and CO2 variations over the past several centuries. As a by-product, the researchers are determining growth rates and longevity of these organisms, important information for establishing conservation and marine policy.
Guilderson and former Livermore colleague Stewart Fallon, together with researchers from Stanford University and the University of California, have been studying deep-sea corals off the coast of Hawaii and elsewhere in the Pacific. For this project, the team deployed human-operated deep-sea research submersibles and remote-operated vehicles to collect samples from the deep ocean. Using radiocarbon dating at CAMS, the researchers determined the ages of deep-sea corals Geradia sp., colloquially known as gold coral, and Leiopathes sp., a deep-water black coral. The longest-lived in each species was 2,740 years and 4,270 years, respectively. At more than 4,000 years old, the deep-water black coral is the oldest known living skeletal-accreting marine organism.
Other dating methods indicated that the Geradia coral was much younger. “The ages established at CAMS far exceed previous estimates,” Guilderson says. “Individual polyps appear to live only a few years, but they have been continuously replaced for up to thousands of years while accreting their underlying skeleton.”
Prior to the research, some scientists thought the corals might feed on resuspended sediment (which could be old) rather than on recently photosynthesized carbon falling through the water. They also conjectured that corals might stop growing after reaching a certain size. The CAMS research showed that coral polyps eat material that descends from the surface. As a result, says Guilderson, “Deep-water ecosystems are tightly tied to what happens in surface waters because that’s where those ecosystems get their food. In addition, because of the close relationship between deep-sea corals and ocean surfaces, corals can be affected by natural and human-made changes in surface ocean conditions, including ocean acidification and warming.”
Guilderson notes that long-lived coral communities provide critical habitat for fish and invertebrates, but their survival is threatened by activities such as commercial fishing, trawling, and pipe laying, and in some areas, by the precious coral jewelry industry. By better understanding the ecology of deep-sea corals, researchers can help guide effective conservation strategies. The recent massive oil spill in the Gulf of Mexico has brought attention to the deep-sea coral communities and ecosystems in that region, which were discovered less than a decade ago.
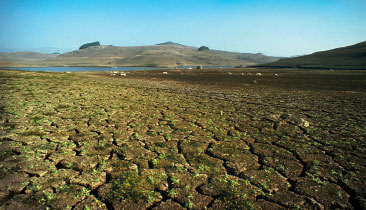 |
This photograph shows the effects of the 1976 drought on Folsom Lake in California, a state with a long history of prolonged droughts. For the past 100 years, however, California has experienced a relatively wet climate, which could lead to an inaccurate interpretation of results unless climate models incorporate precipitation data from thousands of years ago. (Courtesy of California Department of Water Resources.) |
 |
Susan Zimmerman takes samples from lake beds and escarpments in California. By radiocarbon-dating the samples, researchers are reconstructing the state’s climate pattern for the last 2,000 years. |
Past Drought Patterns in California
Current global and regional climate models typically incorporate data from only the past 100 to 150 years. As a result, they may not reflect climate’s variability when predictions are extended to hundreds or thousands of years. For example, tree-ring records indicate that over the last century, the western U.S. has been relatively wet compared with conditions for the past few hundred years. Without additional long-term data from periods of prolonged drought, current models may be biased toward wet conditions. By analyzing sediments up to 2,000 years old, geochemist Susan Zimmerman is helping to refine regional climate models and thereby improve the accuracy of climate change predictions.
“We want to use the geologic records of climate conditions together with climate models to better understand what caused climate change in the past and gain insight into present and future variations,” Zimmerman says. Through a project funded by Livermore’s Laboratory Directed Research and Development Program, she is developing lake-sediment records of the natural changes in California’s climate, with the focus on tracking the number of droughts through the centuries. “We’re taking time slices of California climate for the last 2,000 years to help us reconstruct historical patterns,” she says.
Accurately predicting the timing, amount, and patterns of precipitation is especially critical in California, with its growing population, enormous agricultural industry, and propensity for droughts. In particular, state agencies responsible for meeting future water demands must depend on scientific estimates for precipitation over the next few decades.
Zimmerman is working with researchers across California to analyze sediments taken from Zaca, Klamath, Big Bear, Mono, and Big Soda lake beds, among others. “Lakes are long-lived, wet areas where materials are continually deposited over time,” Zimmerman says. The lake-sediment data complement annual tree-ring records of precipitation, which are mainly available from 1400 AD to the present. The lake-sediment records provide similar information but span much longer periods than the tree-ring data.
The researchers date samples from the lake cores by measuring the ratio of radiocarbon to the stable isotope carbon-13. CAMS is ideal for this task because it can measure hundreds of samples per month and produces highly precise results. The researchers examine two different sources of radiocarbon: organic carbon such as pine needles, twigs, and other macrofossils; and inorganic carbon, such as the calcium carbonate found in gastropods, ostracodes (millimeter-scale crustaceans indicative of wet periods), and other types of shells.
Zimmerman is also working with geochemist Sidney Hemming at Columbia University’s Lamont-Doherty Earth Observatory to date samples from the bottom of California’s Mono Lake and its escarpments. She found high levels of ostracodes in Mono Lake sediments dating from the last ice age. “We’re very interested in the timing of the last big rise and subsequent drop in water levels at Mono Lake,” says Zimmerman, “and to what extent those changes in water depth are consistent with the drastic climate changes recorded in Greenland at the end of the last ice age.”
The ultimate goal of the CAMS projects is to determine what forces are driving climate changes. “We don’t have enough historical observations,” she says. “We need more extensive paleoclimate records to help us determine to what extent current climate change is human activity and how much is natural variation.”
—Arnie Heller
Key Words: black coral, carbon-12, carbon-14, carbon dioxide (CO2), Center for Accelerator Mass Spectrometry (CAMS), climate change, Geradia sp., gold coral, Leiopathes sp., photosynthesis, Program for Climate Model Diagnosis and Intercomparison, radiocarbon dating.
For further information contact Graham Bench (925) 423-5155 (bench1@llnl.gov).
Home | LLNL
Home | LLNL Site Map | Top
Site designed and maintained by TID’s Web & Multimedia Group
Lawrence Livermore National Laboratory
Operated by Lawrence Livermore National Security, LLC, for the
U.S. Department of Energy’s National Nuclear Security Administration
Privacy & Legal Notice | UCRL-TR-52000-10-12 | December 6, 2010