Skip Navigation Linkwww.nws.noaa.gov 
NOAA logo - Click to go to the NOAA homepage National Weather Service   NWS logo - Click to go to the NWS homepage
Ohio River Forecast Center
Local weather forecast by
"City, ST"
  

USA.gov is the U.S. government's official web portal to all federal, state and local government web resources and services.

Ohio River Valley Drought and Precipitation Information


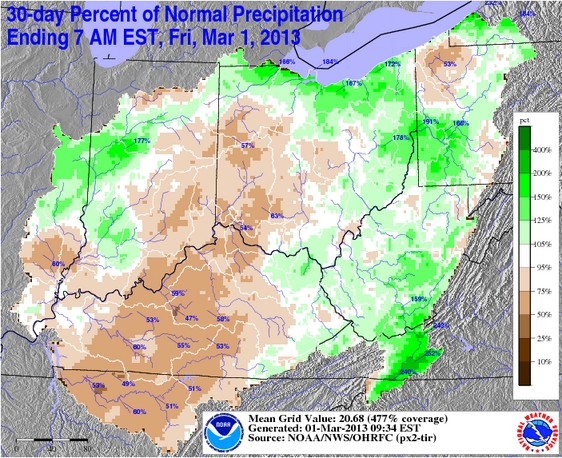
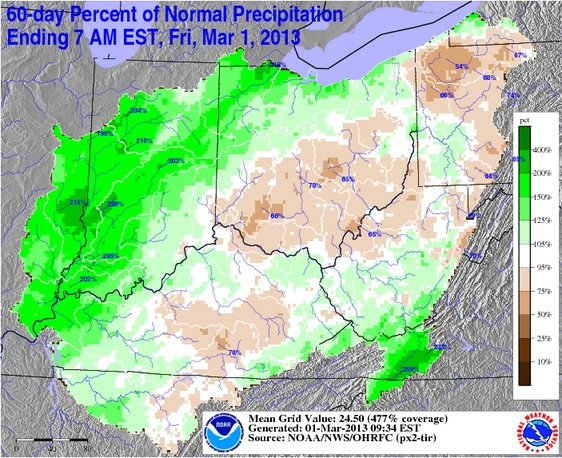
Recent Ohio Valley Precipitation

thumbnail of 30-day precip

30-Day Total Precipitation across the Ohio Valley (updated daily)

thumbnail of 30-day precip departure from normal

30-Day Percent of Normal across the Ohio Valley (updated daily)

thumbnail of 60-day precip

60-Day Total Precipitation across the Ohio Valley (updated daily)

thumbnail of 60-day precip departure from normal

60-Day Percent of Normal across the Ohio Valley (updated daily)

thumbnail of 90-day precip 90-Day Total Precipitation across the Ohio Valley (updated daily) thumbnail of 90-day precip departure from normal 90-Day Percent of Normal across the Ohio Valley (updated daily)
thumbnail of 180-day precip 180-Day Total Precipitation across the Ohio Valley (updated daily) thumbnail of 180-day precip departure from normal 180-Day Percent of Normal across the Ohio Valley (updated daily)
thumbnail of 1-Yr precip 1-Yr Total Precipitation across the Ohio Valley (updated daily) thumbnail of 1-Yr precip departure from normal 1-Yr Percent of Normal across the Ohio Valley (updated daily)

Palmer Drought Index Information

thumbnail of Palmer Drought Index Palmer Drought Index (Climate Prediction Center)
thumbnail of experimental Forecast Palmer Drought Index Experimental Forecast Palmer Index (based on MRF model)

See Latest NOAA Public Drought Information

USGS Stream Flow Information

USGS Stream Flow Conditions
 

Palmer Drought Information by region by the Climate Operations Branch - Climate Prediction Center
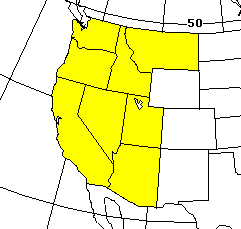
Western Region
map showing Western Region states

 Central Region
map showing Central Region States

Eastern Region
map showing Eastern Region states

Southern Region
map showing Southern Region states

Explanation to the Weekly Palmer Index Values
Explanation to the Projected Palmer Index Values

To find locations of specific divisions, refer to the state divisions maps (NCDC).

Other Drought Links . . .

  Thursday, December 12, 2002
National Weather Service
Ohio River Forecast Center
1901 South State Route 134
Wilmington, OH 45177-9708
Page last modified: Friday, November 16, 2012 11:43 AM
Disclaimer
Information Quality
Credits
Glossary
Privacy Policy
Freedom of Information Act (FOIA)
About Us
Career Opportunities