PMI Results
 |
|
| ITNs are one of four highly-effective malaria interventions supported by PMI. Source: Maggie Hallahan Photography |
|
Over the past five years, many African countries have reported substantial progress in reducing their burden of malaria. Mortality in children under five years of age has fallen dramatically in association with a massive scale-up of malaria control efforts with insecticide-treated mosquito nets (ITNs), indoor residual spraying (IRS), improved diagnostic tests, and highly effective antimalarial drugs. Evidence is growing that the cumulative efforts and funding by the President’s Malaria Initiative (PMI); national governments; The Global Fund to Fight AIDS, Tuberculosis and Malaria; the World Bank; and many other donors are having an effect and that the risk of malaria is declining. In fact, according to the World Health Organization’s 2011 World Malaria Report, the estimated number of global malaria deaths fell from about 985,000 in 2000 to about 655,000 in 2010, with most of this reduction occurring in sub-Saharan Africa.
This page summarizes the progress PMI has achieved after six years of implementation. For more details, please access the PMI Sixth Annual Report, April 2012 [PDF, 10.2MB].
Progress After Six Years of Implementation
 |
|
| 1. The data reported in this table are up-to-date as of September 30, 2011, and include all PMI focus countries and the Greater Mekong Subregion. In addition, during FY2011, the U.S. Government provided support for malaria prevention and control activities in other countries. For data by country, see Appendix 2. 2. A cumulative count of people protected by IRS is not provided becayse most areas are sprayed on more than one occasion. 3. Distribution of ITNs varies and includes to health facilities, direct distribution to households through mass campaigns, and through the private sector via social marketing. 4. Distrubuted to health facilities. 5. These figures include health workers who were trained in focused antenatal care in Rwanda, where IPTp is not national policy. 6. A cumulative count of individual health workers trained is not provided because some health workers have been trained on more than one occasion. *For Year 6, PMI transitioned from a calendar year to a fiscal year reporting schedule. |
|
Impact on Mortality of Children Under Five Years of Age
 |
|
| The PMI focus countries included in this graph have at least two data points from nationwide household surveys that measure mortality in children under the age of five. These data are draw from Demographic and Health Surveys, Multiple Indicator Cluster Surveys, and, in a small number of cases, from Malaria Indicator Surveys with expanded sample sizes. In some countries, two surveys were conducted within the same period. In Angola, both estimates for under-five mortality are derived from the 2011 Malaria Indicator Survey. | |
Coverage of Malaria Interventions
Eleven PMI focus countries have now reported results of recent nationwide household surveys that allow a comparison with similar surveys used as the PMI baseline. In those 11 countries:
 |
|
| The PMI focus countries included in this graph have at least two data points for ITN ownership from nationwise household surveys, Malaria Indicator Surveys, or Multiple Indicator Cluster Surveys). In some countries, two surveys were conducted within the same period. | |
 |
|
| The PMI focus countries included in this graph have at least two data points for ITN ownership from nationwise household surveys, Malaria Indicator Surveys, or Multiple Indicator Cluster Surveys). In some countries, two surveys were conducted within the same period. | |
 |
|
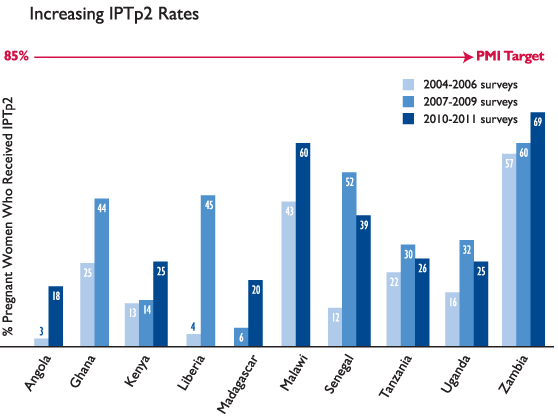
| The PMI focus countries included in this graph have at least two data points for IPTp2 from nationwide household surveys (Demographic and Health Surveys or Malaria Indicator Surveys). In some countries, two surveys were conducted within the same period.IPTp2 is defined as at least two doses of SP during the last pregnancy, with at least one dose given during an antenatal clinic visit. | |