Short-Term Energy and Winter Fuels Outlook
Release Date: October 10, 2012 | Next Release Date: November 6, 2012 | Full Report | Text Only | All Tables | All Figures
U.S. Crude Oil and Liquid Fuels
U.S. Liquid Fuels Consumption
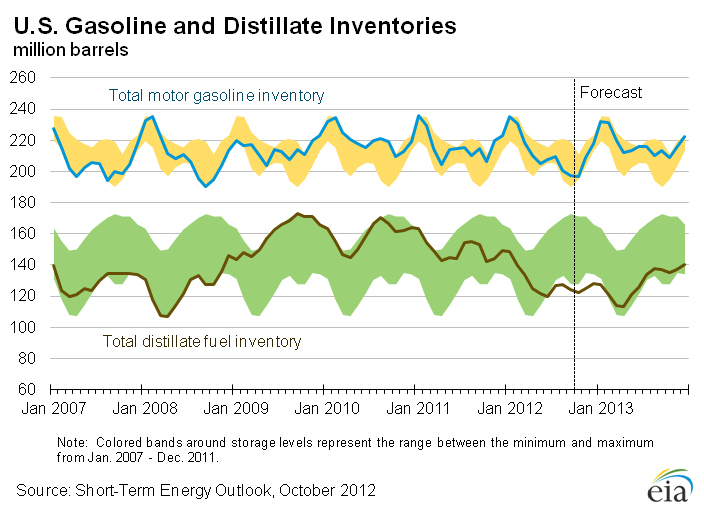
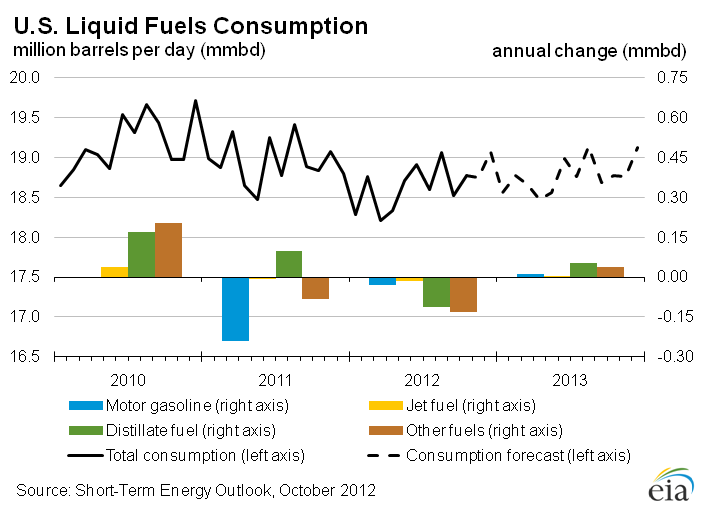
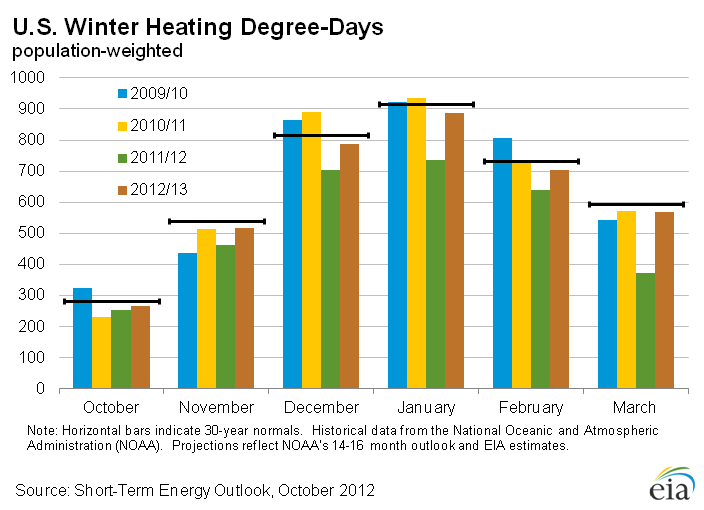
Total liquid fuels consumption fell 230 thousand bbl/d (1.2 percent) in 2011, driven by a 240-thousand-bbl/d drop in motor gasoline consumption. Forecast total liquid fuels consumption falls by 280 thousand bbl/d (1.5 percent) in 2012 including a decline in motor gasoline consumption of 30 thousand bbl/d. Warm weather during the first half of the year contributes to a projected 110-thousand-bbl/d decline in distillate fuel oil consumption in 2012. In 2013, total liquid fuels consumption increases by 110 thousand bbl/d (0.6 percent). Most of the recovery in consumption next year comes from distillate fuel oil and natural gas liquids consumption, which rise because of continued growth in freight shipments and industrial use as well as the assumption of near-normal weather this coming winter.
Despite higher assumed growth in U.S. real disposable income and projected declines in retail gasoline pump prices of 6 percent in 2013, forecast motor gasoline consumption remains almost unchanged from that of the previous year because of continued slow growth in the driving-age population, improvements in the average fuel economy of new vehicles, and increased rates of retirement of older, less-fuel-efficient vehicles.

U.S. Liquid Fuels Supply and Imports
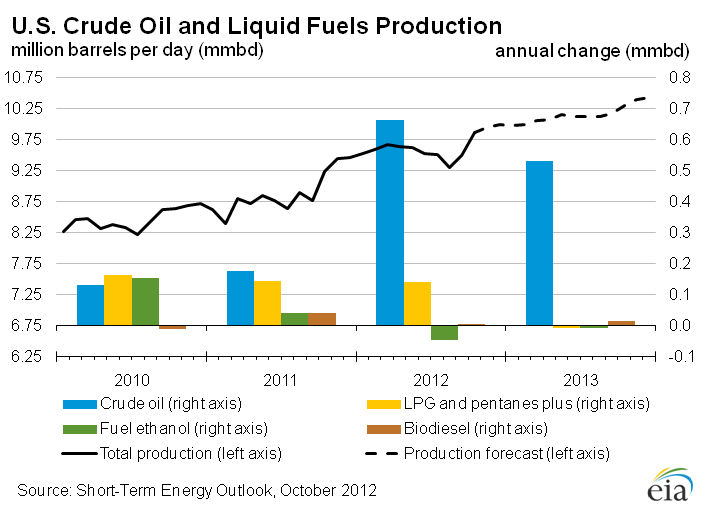
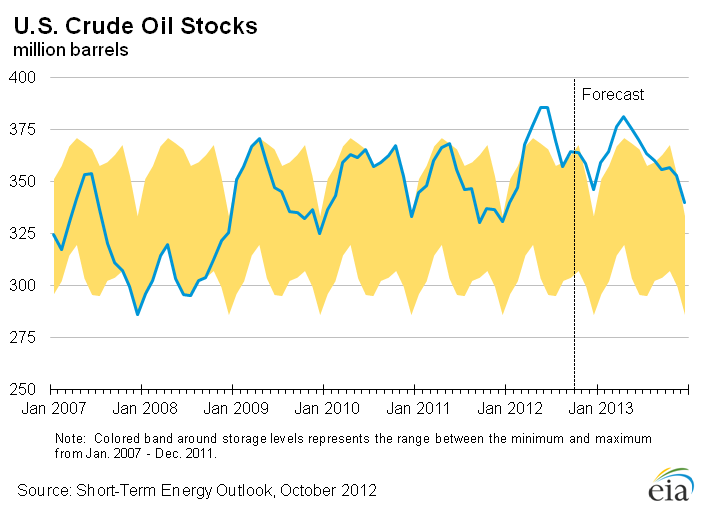
Domestic crude oil production increased by an estimated 180 thousand bbl/d (3.2 percent) to 5.7 million bbl/d in 2011. Forecast crude oil production increases to 6.3 million bbl/d in 2012 with lower-48 (excluding the federal Gulf of Mexico) crude oil production growing by 780 thousand bbl/d, primarily from the Bakken, Permian basin, and Eagle Ford producing areas. Hurricane Isaac in the Gulf of Mexico led to U.S. crude oil production shut-ins averaging 220 thousand bbl/d in August and 200 thousand bbl/d in September. Total crude oil output rises a further 530 thousand bbl/d in 2013. The number of onshore oil-directed drilling rigs reported by Baker Hughes has increased from 777 at the beginning of 2011 to 1,191 at the start of 2012, and to 1,398 as of October 5, 2012.
The share of total U.S. consumption met by liquid fuel net imports of both crude oil and products has been falling since peaking at over 60 percent in 2005. In 2011, it averaged 45 percent, down from 49 percent in 2010. EIA expects that the total net import share of consumption will continue to decline to 41 percent in 2012 and to 39 percent in 2013 because of the substantial increases in domestic crude oil production. If the 2013 forecast holds true, it would be the first time the share of total U.S. consumption met by liquid fuel net imports is less than 40 percent since 1991.

U.S. Petroleum Product Prices
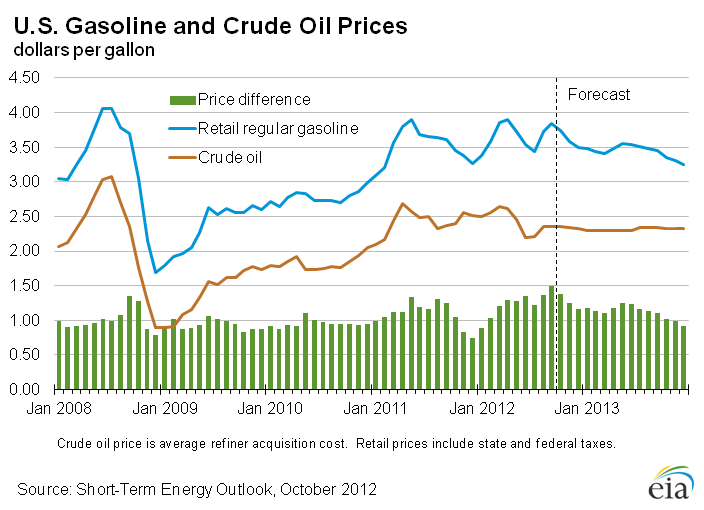
After a sharp increase in retail gasoline prices earlier this year, the monthly average price for regular grade gasoline reached $3.90 per gallon in April 2012. Prices then fell for three consecutive months, averaging $3.44 per gallon in July. Rising crude prices contributed to a second run-up in regular gasoline retail prices to an average of $3.85 per gallon in September 2012. EIA expects retail gasoline prices to begin declining in October as the gasoline market transitions from summer-grade to winter-grade gasoline specifications and forecast crude oil prices begin to fall. Projected regular gasoline retail prices average $3.60 per gallon during the fourth quarter of 2012, up slightly from $3.58 per gallon projected in last month's Outlook. Projected regular gasoline retail prices average $3.65 per gallon in 2012 and $3.44 per gallon in 2013.
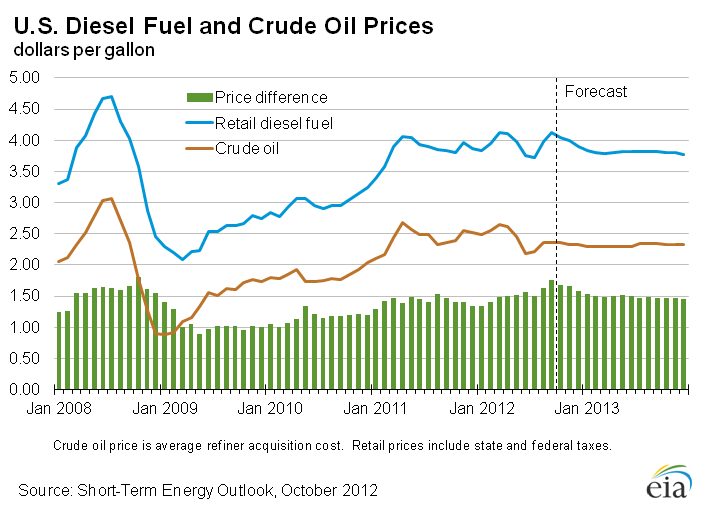
Diesel fuel retail prices rose from a monthly average of $3.83 per gallon to January 2012 to a high of $4.13 in March, then fell to a low of $3.72 in July. Tight market conditions and increasing crude oil prices drove on-highway diesel fuel prices back near monthly highs for the year average $4.12 per gallon in September. EIA expects that on-highway diesel fuel retail prices will average $3.98 per gallon during the fourth quarter of this year and $3.81 per gallon in 2013. Wholesale diesel margins (the difference between the wholesale price of diesel and the refiner acquisition cost of crude oil) averaged 60 cents per gallon the first half of 2012 before climbing to an estimated 85 cents per gallon in September, the highest level since May 2008. In 2012, EIA projects those margins will average 68 cents per gallon in 2012 and 63 cents per gallon in 2013, compared with the previous 5-year average of 52 cents per gallon.
| U.S. Crude Oil and Liquid Fuels Summary | ||||
|---|---|---|---|---|
| 2010 | 2011 | 2012 projected | 2013 projected | |
| Crude Oil prices | (dollars per barrel) | |||
| WTI Spot Average | 79.40 | 94.86 | 95.55 | 92.63 |
| Brent Spot Average | 79.51 | 111.26 | 111.80 | 103.38 |
| Imported Average | 75.87 | 102.65 | 101.37 | 97.63 |
| Refiner Average Acquisition Cost | 76.71 | 101.91 | 100.95 | 97.39 |
| Retail prices including taxes | (dollars per gallon) | |||
| Regular Gasoline | 2.78 | 3.53 | 3.65 | 3.44 |
| Diesel Fuel | 2.99 | 3.84 | 3.96 | 3.81 |
| Heating Oil | 2.95 | 3.68 | 3.76 | 3.69 |
| Production | (million barrels per day) | |||
| Crude Oil | 5.48 | 5.66 | 6.32 | 6.85 |
| Natural Gas Liquids | 2.07 | 2.22 | 2.36 | 2.35 |
| Fuel Ethanol | 0.87 | 0.91 | 0.86 | 0.85 |
| Biodiesel | 0.022 | 0.063 | 0.068 | 0.083 |
| Consumption | (million barrels per day) | |||
| Motor Gasoline | 8.99 | 8.75 | 8.72 | 8.74 |
| Distillate Fuel Oil | 3.80 | 3.90 | 3.79 | 3.84 |
| Jet Fuel | 1.43 | 1.43 | 1.41 | 1.41 |
| Total Consumption | 19.18 | 18.95 | 18.67 | 18.77 |
| Primary Assumptions | (percent change from previous year) | |||
| U.S. Real GDP Growth | 2.4 | 1.8 | 2.2 | 1.7 |
| Heating-degree days | -0.6 | -3.4 | -10.2 | 14.2 |
| Distillate-weighted Industrial Production | 6.3 | 4.6 | 3.9 | 1.5 |
Interactive Data Viewers
Provides custom data views of historical and forecast data
STEO Custom Table Builder ›
Real Prices Viewer ›
| Related Tables | |||||||
|---|---|---|---|---|---|---|---|
| Table WF01. Average Consumer Prices and Expenditures for Heating Fuels During the Winter | |||||||
| Table 1. U.S. Energy Markets Summary | |||||||
| Table 2. U.S. Energy Prices | |||||||
| Table 4a. U.S. Crude Oil and Liquid Fuels Supply, Consumption, and Inventories | |||||||
| Table 4b. U.S. Petroleum Refinery Balance | |||||||
| Table 4c. U.S. Regional Motor Gasoline Prices and Inventories | |||||||
| Table 9a. U.S. Macroeconomic Indicators and CO2 Emissions | |||||||
| Table 9b. U.S. Regional Macroeconomic Data | |||||||
| Table 9c. U.S. Regional Weather Data | |||||||
| Related Articles | ||
|---|---|---|
| Today In Energy | Daily | |
| This Week in Petroleum | Weekly | |
| Change in STEO Regional and U.S. Degree Day Calculations | Sep-2012 | |
| Brent Crude Oil Spot Price Forecast | Jul-2012 | |
| 2012 Outlook for Hurricane-Related Production Outages in the Gulf of Mexico | Jun-2012 | |
| 2012 Summer Transportation Fuels Outlook Slideshow | Apr-2012 | |
| 2011-2012 Winter Fuels Outlook Slideshow | Oct-2011 | |
| STEO Notice: Suspension of Regional Residential Heating Oil and Propane Price Forecast | Jun-2011 | |
| Probabilities of Possible Future Prices | Apr-2010 | |
| Energy Price Volatility and Forecast Uncertainty | Oct-2009 |