Total Energy
Annual Energy Review
September 2012 PDF | previous editions
Release Date: September 27, 2012
Next Update: August 2013
Petroleum Flow, (Million Barrels per Day)

Footnotes:
1 Unfinished oils, hydrogen/oxygenates/renewables/other hydrocarbons, and motor gasoline
and aviation gasoline blending components.
2 Renewable fuels and oxygenate plant net production (0.972), net imports (1.164) and adjustments
(0.122) minus stock change (0.019) and product supplied (0.001).
3 Finished petroleum products, liquefied petroleum gases, and pentanes plus.
4 Natural gas plant liquids.
5 Field production (2.183) and renewable fuels and oxygenate plant net production (-.019) minus refinery and blender net imputs (0.489).
6 Production minus refinery input.
(s)= Less than 0.005.
Notes:
• Data are preliminary.
• Values are derived from source data prior to rounding for publication.
• Totals may not equal sum of components due to independent rounding.
Sources:
U.S. Energy Information Administration, Annual Energy Review 2011
Tables 5.1b, 5.3, 5.5, 5.8, 5.11, 5.13a-5.13d, 5.16; U.S. Energy Information Administration, Petroleum Supply Monthly, February 2012, Table 4; and revisions to crude oil production and adjustments (see sources for Table 5.1b).
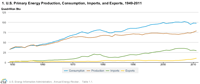
Energy Perspectives
Forty-two interactive graphs showing trends in U.S. energy production, consumption, and trade from 1949-2011
Changes in AER 2011:
- Sales of Fossil Fuels Produced on Federal and American Indian Lands (Table 1.14), previously titled "Fossil Fuel Production on Federally Administered Lands," now provides data on sales of fossil fuels from Federal and American Indian lands for fiscal years 2003 through 2011.
- Industrial Sector Energy Consumption Estimates (Table 2.1d), Renewable Energy Consumption: Industrial and Transportation Sectors (Table 10.2b), Electricity Net Generation: Commercial and Industrial Sectors, (Table 8.2d), and Consumption for Electricity Generation by Energy Source: Commercial and Industrial Sectors (Table 8.4c) have been modified to include industrial wind consumption.
- Petroleum and Other Liquids Overview (Table 5.1a), Petroleum Overview (Table 5.1b), and Crude Oil Production and Crude Oil Well Productivity (Table 5.2) now incorporate revisions to crude oil production, total field production, and adjustments in coordination with the Petroleum Supply Monthly.
- See full list for changes >
Energy Graphs
