Total Energy
Annual Energy Review
September 2012 PDF | previous editions
Release Date: September 27, 2012
Next Update: August 2013
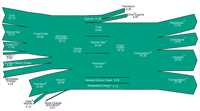
Electricity Flow, (Quadrillion Btu)

Footnotes:
1 Blast furnace gas, propane gas, and other manufactured and waste gases derived from
fossil fuels.
2 Batteries, chemicals, hydrogen, pitch, purchased steam, sulfur, miscellaneous technologies,
and non-renewable waste (municipal solid waste from non-biogenic sources, and tire-derived
fuels).
3 Data collection frame differences and nonsampling error. Derived for the diagram by
subtracting the “T & D Losses” estimate from “T & D Losses and Unaccounted for” derived from Table 8.1.
4 Electric energy used in the operation of power plants.
5 Transmission and distribution losses (electricity losses that occur between the point of
generation and delivery to the customer) are estimated as 7 percent of gross generation.
6 Use of electricity that is 1) self-generated, 2) produced by either the same entity that
consumes the power or an affiliate, and 3) used in direct support of a service or industrial
process located within the same facility or group of facilities that house the generating equipment.
Direct use is exclusive of station use.
Notes:
• Data are preliminary.
• See Note, “Electrical System Energy Losses,” at the end of Section 2.
• Net generation of electricity includes pumped storage facility production minus energy used for pumping.
• Values are derived from source data prior to rounding for publication.
• Totals may not equal sum of components due to independent rounding.
Sources:
U.S. Energy Information Administration, Annual Energy Review 2011 Tables 8.1, 8.4a, 8.9, A6 (column 7), and U.S. Energy Information
Administration, Form EIA-923, "Power Plant Operations Report."
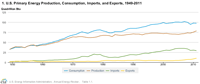
Energy Perspectives
Forty-two interactive graphs showing trends in U.S. energy production, consumption, and trade from 1949-2011
Changes in AER 2011:
- Sales of Fossil Fuels Produced on Federal and American Indian Lands (Table 1.14), previously titled "Fossil Fuel Production on Federally Administered Lands," now provides data on sales of fossil fuels from Federal and American Indian lands for fiscal years 2003 through 2011.
- Industrial Sector Energy Consumption Estimates (Table 2.1d), Renewable Energy Consumption: Industrial and Transportation Sectors (Table 10.2b), Electricity Net Generation: Commercial and Industrial Sectors, (Table 8.2d), and Consumption for Electricity Generation by Energy Source: Commercial and Industrial Sectors (Table 8.4c) have been modified to include industrial wind consumption.
- Petroleum and Other Liquids Overview (Table 5.1a), Petroleum Overview (Table 5.1b), and Crude Oil Production and Crude Oil Well Productivity (Table 5.2) now incorporate revisions to crude oil production, total field production, and adjustments in coordination with the Petroleum Supply Monthly.
- See full list for changes >
Energy Graphs