a. Synoptic History
A tropical wave that emerged from Africa on 11 July appears to be the system
that eventually spawned Emilia. This wave moved across the tropical
Atlantic, reaching the Lesser Antilles about a week later. As it continued
westward, the system produced little deep convection over the Caribbean Sea.
However, cloud motions indicated the presence of a mid-level vorticity
maximum over Venezuela on 19 July. A couple of days later, convective
cloudiness increased over Panama as the wave reached the area. The system
crossed Central America on the 22nd, and on the 23rd,
an area of showers that showed some cyclonic rotation was noted a few
hundred miles southeast of the Gulf of Tehuantepec. There was not much
increase in organization of the system until around 0000 UTC on the
25th, when the convective cloud pattern showed enough curved
banding to warrant an initial T1.0 Dvorak classification.
For the next day or so, the system developed rather slowly, but by 0600 UTC 26
July it is estimated that Tropical Depression Seven-E formed about 290 n mi
south-southwest of Manzanillo, Mexico. Later on the 26th, visible
satellite images showed a band of convection wrapping about halfway around
the center, which indicated that the cyclone strengthened into Tropical
Storm Emilia around 1800 UTC on that date. A low- to mid-level ridge to the
north of the storm steered Emilia on a course between northwest and
west-northwest. Initially, the environment was favorable for strengthening.
Around 1800 UTC 27 July, the storm's cloud pattern became more tightly
wound, and microwave imagery suggested a formative eyewall. Emilia
strengthened to its estimated maximum intensity of 55 knots at that time,
while centered about 60 n mi southwest of Socorro Island. Just 6 to 12 h
later, the storm was moving over cooler sea surface temperatures, and
entraining drier air from a mid- to upper-level trough to its northwest.
Under the continued influence of cooler waters and drier air, deep
convection associated with Emilia diminished, and the system slowly
weakened. Guided by the lower-tropospheric steering flow, the cyclone
turned westward, and weakened below storm strength by about 1800 UTC 29
July. Emilia dissipated soon thereafter, several hundred miles
west-southwest of Cabo San Lucas, Mexico.
b. Meteorological Statistics
Table 1
gives the best track positions and intensities of Emilia at
six-hourly intervals. Figure 1
shows a plot of this track. Figure 2 and
Figure 3
depict the curves of maximum one-minute average "surface" (10 meters above
ground level) wind speed and minimum central sea-level pressure,
respectively, as functions of time. Also plotted are the observations on
which the curves are based. These consist of Dvorak-technique estimates
using satellite imagery by the Tropical Analysis and Forecast Branch (TAFB),
the Satellite Analysis Branch (SAB), and the U.S. Air Force Weather Agency
(AFWA).
c. Casualty and Damage Statistics
No reports of casualties or damages associated with Emilia have been
received.
d. Forecast and Warning Critique
Emilia was a short-lived tropical cyclone, and there were no 72 h official
forecasts at tropical storm stage to verify. The mean official forecast
errors at 12, 24, 36, and 48 h were 32, 52, 55, and 64 n mi, respectively
(the number of cases ranged from 10 at 12 h to just 4 at 48 h). These
errors are quite low, indicating that Emilia's track was well forecast in
the NHC advisories. In contrast, the track guidance models generally had
higher average errors. NOGAPS, UKMI, and GUNS had much higher average errors
than the official forecast, but the number of cases was quite small.
The official forecasts from the first several NHC advisories incorrectly
showed Emilia reaching hurricane strength.
Table 1.
Best track, Tropical Storm Emilia, 26-30 July, 2000.
Date/Time
(UTC) | Position |
Pressure
(mb) |
Wind Speed
(kt) | Stage |
| Lat. (°N) | Lon. (°W) |
| 26 / 0600 | 14.9 | 106.9 | 1007 | 25 | tropical depression |
| 26 / 1200 | 15.3 | 107.7 | 1006 | 30 | " |
| 26 / 1800 | 15.8 | 108.4 | 1005 | 35 | tropical storm |
| 27 / 0000 | 16.2 | 109.0 | 1002 | 40 | " |
| 27 / 0600 | 16.8 | 109.8 | 1000 | 45 | " |
| 27 / 1200 | 17.4 | 110.8 | 998 | 45 | " |
| 27 / 1800 | 18.1 | 111.8 | 994 | 55 | " |
| 28 / 0000 | 18.8 | 112.9 | 996 | 55 | " |
| 28 / 0600 | 19.4 | 113.8 | 997 | 50 | " |
| 28 / 1200 | 19.9 | 114.7 | 997 | 50 | " |
| 28 / 1800 | 20.1 | 115.8 | 1000 | 45 | " |
| 29 / 0000 | 20.1 | 117.0 | 1004 | 40 | " |
| 29 / 0600 | 20.2 | 117.9 | 1005 | 35 | " |
| 29 / 1200 | 20.3 | 118.9 | 1006 | 35 | " |
| 29 / 1800 | 20.3 | 120.0 | 1006 | 30 | tropical depression |
| 30 / 0000 | 20.4 | 120.8 | 1007 | 25 | " |
| 30 /0600 | | dissipated |
| |
| 27 / 1800 | 18.1 | 111.8 | 994 | 55 | minimum pressure |
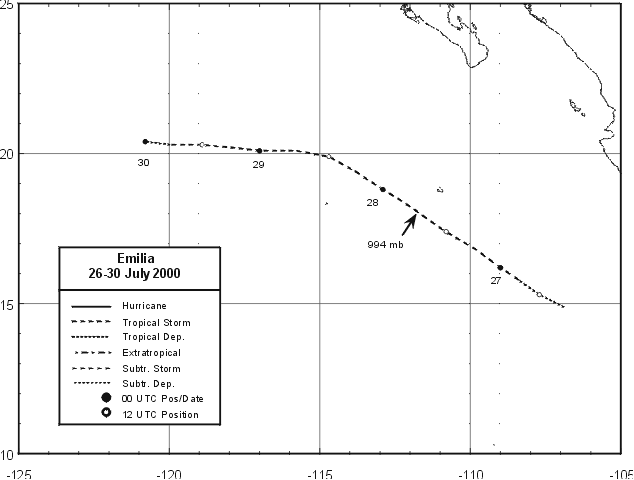
Figure 1.
Best track positions for Tropical Storm Emilia, 26-30 July 2000.

Figure 2.
Best track maximum sustained surface wind speed curve for Tropical Storm
Emilia, 26-30 July 2000, along with the available intensity estimates.
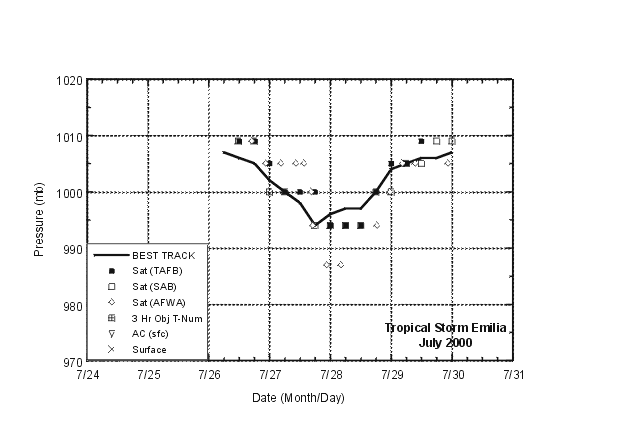
Figure 3.
Best track minimum central pressure curve and central pressure estimates for
Tropical Storm Emilia, 26-30 July 2000.
![[NCEP Logo]](graphics/ncep.gif)


