Short-Term Energy Outlook
Release Date: September 11, 2012 | Next Release Date: October 10, 2012 | Full Report | Text Only | All Tables | All Figures
Renewables and CO2 Emissions
U.S. Renewables
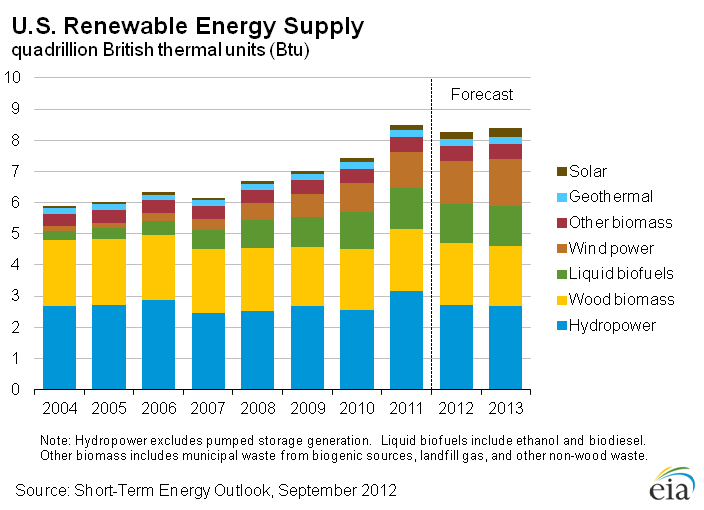
After growing by 13.8 percent in 2011, total renewable energy consumption is projected to decline by 2.3 percent in 2012. This decrease is the result of hydropower resource levels beginning to return to the long-term average, with consumption falling by 0.4 quadrillion Btu (13.9 percent). The decline in hydropower from 2011 to 2012 more than offsets the projected growth in the consumption of other renewable energy forms. Renewable energy consumption increases 2.0 percent in 2013 as hydropower continues to decline (2.2 percent) but non-hydropower renewables grow by an average of 4.1 percent.
Under current law, federal production tax credits for wind-powered generation will not be available for turbines that begin operating after the end of 2012. Wind-powered generation, which grew by 26 percent in 2011, is forecast to grow an additional 18 percent in 2012. The outlook for wind capacity additions and generation in 2013 will likely respond to whatever decision is made regarding the extension of production tax credits.
As a result of drought conditions affecting corn harvests throughout the Midwest, ethanol production fell from an average of 887 thousand bbl/d in June 2012 to 808 thousand bbl/d in July, and then modestly rebounded to 822 thousand bbl/d in August. EIA expects ethanol production will average 830 thousand bbl/d over the second half of 2012. Forecast ethanol production recovers in the second half of 2013, averaging 870 thousand bbl/d (13.3 billion gallons) for the year. The projected lower ethanol production is generally matched by lower ethanol exports. Biodiesel production averaged about 63 thousand bbl/d (967 million gallons) in 2011. Forecast biodiesel production averages 70 thousand bbl/d in 2012 and 75 thousand bbl/d in 2013.
U.S. Energy-Related CO2 Emissions
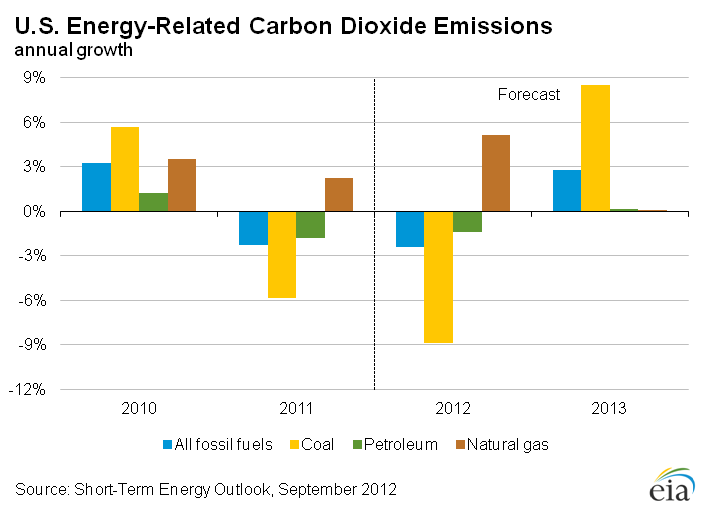
After declining by 2.3 percent in 2011, fossil fuel emissions are projected to further decline by 2.4 percent in 2012, but this decline is followed by an increase of 2.8 percent in 2013. Petroleum emissions decline in 2012 (1.4 percent) and grow only 0.2 percent in 2013. Natural gas emissions rise by 5.2 percent and 0.1 percent in 2012 and 2013, respectively. Coal emissions decline 8.9 percent in 2012, but their projected rise of 8.5 percent in 2013 is spurred by a 19-percent increase in the cost of natural gas for electricity while the cost of coal for power generation stays flat.
| U.S. Renewables & CO2 Emissions Summary | ||||
|---|---|---|---|---|
| 2010 | 2011 | 2012 projected | 2013 projected | |
|
a Conventional hydroelectric power only. Hydroelectricity generated by pumped storage is not included in renewable energy. |
||||
| U.S. Renewables Consumption | (quadrillion Btu) | |||
| Hydroelectric Powera | 2.539 | 3.171 | 2.730 | 2.670 |
| Geothermal | 0.208 | 0.226 | 0.229 | 0.229 |
| Solar | 0.126 | 0.158 | 0.205 | 0.264 |
| Wind | 0.924 | 1.168 | 1.373 | 1.501 |
| Wood Biomass | 1.988 | 1.987 | 1.963 | 1.943 |
| Ethanol | 1.090 | 1.093 | 1.100 | 1.118 |
| Biodiesel | 0.034 | 0.112 | 0.127 | 0.146 |
| Waste Biomass | 0.469 | 0.477 | 0.484 | 0.497 |
| Total | 7.377 | 8.393 | 8.203 | 8.367 |
| Carbon Dioxide Emissions by Fuel | (million metric tons) | |||
| Petroleum and Other Liquid Fuels | 2349 | 2307 | 2274 | 2278 |
| Natural Gas | 1265 | 1294 | 1361 | 1361 |
| Coal | 1982 | 1867 | 1701 | 1846 |
| Total Fossil Fuels | 5595 | 5467 | 5336 | 5485 |
Interactive Data Viewers
Provides custom data views of historical and forecast data
STEO Custom Table Builder ›
Real Prices Viewer ›
| Related Figures | |||||||
|---|---|---|---|---|---|---|---|
| U.S. Renewable Energy Supply | XLS | PNG | |||||
| U.S. Energy-Related Carbon Dioxide Emissions Growth | XLS | PNG | |||||
| Related Articles | ||
|---|---|---|
| Today In Energy | Daily | |
| U.S. Energy-Related Carbon Dioxide Emissions | Annual | |
| State-Level Energy-Related Carbon Dioxide Emissions | Annual | |
| Changes to Electricity and Renewables Tables | Aug-2012 | |
| Emissions of Greenhouse Gases in the United States | 31-Mar-2011 | |
| Understanding the Decline in CO2 Emissions in 2009 | Oct-2009 | |
| Biodiesel Supply and Consumption | Apr-2009 |