Total Energy
Coal Flow, 2010 (Million Short Tons)

Footnotes:
1 Includes fine coal, coal obtained from a refuse bank or slurry dam, anthracite culm, bituminous
gob, and lignite waste that are consumed by the electric power and industrial sectors.
Notes:
• Production categories are estimated; other data are preliminary.
• Values are derived from source data prior to rounding for publication.
• Totals may not equal sum of components due to independent rounding.
Sources:
Tables 7.1, 7.2, and 7.3.
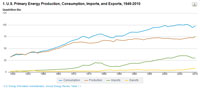
Energy Perspectives
Forty-three interactive graphs showing trends in U.S. energy production, consumption, and trade from 1949-2010
Changes in AER 2010:
- Energy Resources has been expanded to include six maps showing U.S. renewable energy resources.
- Appendix F has been added to include an explanation of alternatives for estimating energy consumption.
- Primary Energy Production by Source (Table 1.2), Consumption for Electricity Generation by Energy Source: Electric Power Sector (Table 8.4b), and other tables have new values for geothermal energy, due to the use of a different Btu conversion factor for geothermal electricity net generation.
- Primary Energy Consumption by Source (Table 1.3) has been reconfigured to display noncombustible renewable energy in three columns: Captured Energy, Adjustment for Fossil Fuel Equivalence, and Primary Energy Total.
- See full list for changes >
Energy Graphs
