Total Energy
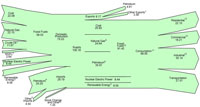
Petroleum Flow, 2010 (Million Barrels per Day)

Footnotes:
1 Unfinished oils, hydrogen/oxygenates/renewables/other hydrocarbons, and motor gasoline
and aviation gasoline blending components.
2 Renewable fuels and oxygenate plant net production (0.92), net imports (1.28) and adjustments
(0.08) minus stock change (0.06) and product supplied (0.02).
3 Finished petroleum products, liquefied petroleum gases, and pentanes plus.
4 Natural gas plant liquids.
5 Production minus refinery input.
Notes:
• Data are preliminary.
• Values are derived from source data prior to rounding for publication.
• Totals may not equal sum of components due to independent rounding.
Sources:
Tables 5.1, 5.3, 5.5, 5.8, 5.11, 5.13a-5.13d, 5.16, and Petroleum Supply Monthly, February 2011, Table 4.
Energy Perspectives
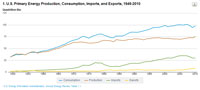
Forty-three interactive graphs showing trends in U.S. energy production, consumption, and trade from 1949-2010
Changes in AER 2010:
- Energy Resources has been expanded to include six maps showing U.S. renewable energy resources.
- Appendix F has been added to include an explanation of alternatives for estimating energy consumption.
- Primary Energy Production by Source (Table 1.2), Consumption for Electricity Generation by Energy Source: Electric Power Sector (Table 8.4b), and other tables have new values for geothermal energy, due to the use of a different Btu conversion factor for geothermal electricity net generation.
- Primary Energy Consumption by Source (Table 1.3) has been reconfigured to display noncombustible renewable energy in three columns: Captured Energy, Adjustment for Fossil Fuel Equivalence, and Primary Energy Total.
- See full list for changes >
Energy Graphs