

Thanks to new research from JPL, it is now easier to accurately track snowmelt -- water from snowpacks that melt in spring -- in mountainous regions.
Read more | Global Climate Change site
EARTH IMAGES from the JPL Photojournal
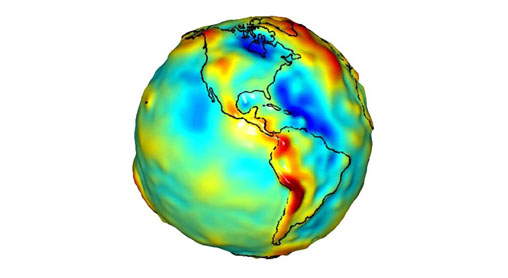
This visualization of a gravity model was created with data from NASA's Gravity Recovery and Climate Experiment, and shows variations in the gravity field across the Americas.
Active Cavity Irradiance Monitor Satellite
Monitors total sun energy that reaches Earth.
› Instrument home page
Atmospheric Infrared Sounder on Aqua satellite
Measures air and surface temperature, clouds, humidity.
› Instrument home page
Microwave Limb Sounder on Aura satellite
Improves understanding of ozone and precursors.
› Mission home page
Tropospheric Emission Spectrometer on Aura satellite
Observes ozone and gases in the troposphere, the part of atmosphere where we live.
› Instrument home page
CloudSat
Revealing the inner secrets of clouds.
› Mission home page
Gravity Recovery and Climate Experiment
Measures Earth's gravitational field.
› Mission home page
Ocean Surface Topography Mission/Jason 2
A follow-on to Jason 1, this mission charts sea level, and its data will help improve climate and weather forecasts.
› Mission home page
Jason-1
Measures ocean level changes and El Niño.
› Mission home page
Quick Scatterometer
Measures ocean surface winds.
› Mission home page
Advanced Spaceborne Thermal Emission and Reflection Radiometer on Terra satellite
Takes high-resolution images, global and local.
› Instrument home page
Multi-angle Imaging Spectro-Radiometer on Terra satellite
Images Earth and aerosols from nine angles.
› Instrument home page
Shuttle Radar Topography Mission
Acquired the most complete near global mapping of Earth's topography.
› Mission home page

|
Satellites Unlock Secret to Northern India's Vanishing Water
Using NASA satellite data, scientists have found that groundwater levels in northern India have been declining by as much as 33 centimeters (1 foot) per year over the past decade.
|

|
NASA Goes Inside a Volcano, Monitors Activity
Scientists have placed high-tech "spiders" inside and around the mouth of Mount St. Helens, the site of the most active volcano in the United States.
|
|
Data From Newest Ocean Satellite Ready for Their 'Close-up'
Fully calibrated, validated data from the NASA-French Space Agency Ocean Surface Topography Mission/Jason-2 satellite are now available, following a year of evaluation.
|

|
Space Age Volcano Monitoring Network
If Mt. Saint Helens erupts again, a team of scientists and engineers will be monitoring with space age technology from NASA. |

|
What's Up for July?
Early astronomers like Galileo used telescopes to map the Milky Way galaxy. This month, you can see the Milky Way in the late evening. |

|
Cruising Over Los Angeles
Take a close-up tour of the L.A. area, courtesy of the space-based ASTER instrument. |