|
Develop a prepared workforce by providing effective training and support services to new and incumbent workers and supplying high-quality information on the economy and labor market.
America's engine of prosperity is its skilled workforce. Maintaining a country's strong national economy depends, in part, on developing a steady stream of workers who possess skills required by today's employers. To expand the size and capabilities of the labor pool, DOL provides comprehensive training programs that focus on specific occupational skills while taking into account job seekers' circumstances. The Department also produces labor statistics that individuals and businesses can use to better understand the job market and the economy. DOL agencies and offices supporting this goal are:
- Bureau of Labor Statistics (BLS),
- Office of Job Corps (OJC),
- Employment and Training Administration (ETA),
- Veterans' Employment and Training Service (VETS),
- Women's Bureau, and
- Center for Faith-Based and Community Initiatives.
Jenira, age 19, is a freshman at Penn State University's Shenango Valley campus. Her high school principal referred her to the WIA Youth program at PA CareerLink Mercer County during her senior year of high school because she became homeless in the 11th grade when her mother was incarcerated. Jenira enrolled in the program, was able to obtain part-time employment, and with the help of some of her teachers at Sharon High School, was able to find a small place of her own. She graduated in June, 2007 and continues to support herself and pursue her college education with the help of scholarships. Jenira wants to pursue a career as a Registered Nurse and work with the elderly. She says, "Growing up, I didn't even believe graduating from high school was a possibility, let alone attending college. All my inspiration comes from people putting their trust in me and seeing my best qualities. I have potential... I can make it."
[Photo credit: Commonwealth Media Services] |
 |
A prepared workforce has the skills and the education that employers demand. Education — from literacy to vocational training — plays a fundamental role in preparing workers for life-long employment. In addition, DOL programs focus on helping those who face exceptional barriers to successful employment. These individuals, such as low-income youth and homeless veterans, benefit from training tailored to their unique needs. Here are a few highlights of program outcomes for FY 2008:
For Youth
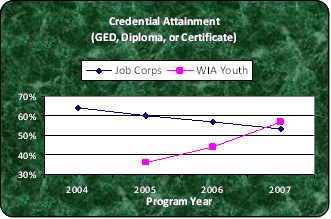
- Despite not meeting its indicator targets, Job Corps continued to place nearly three quarters of the disadvantaged youth it served in employment, post-secondary education, or advanced occupational skills training.
- Fifty-seven percent of the Workforce Investment Act (WIA) Youth program's participants attained credentials such as a General Equivalency Diploma (GED), high school diploma or certificate — the program exceeded the target by 12 percentage points.
For Workers in the Trades
- For the third consecutive year, the fraction of workers in apprenticeship programs who remained employed for nine months after entry rose — to 84 percent, and their average wages rose to nearly $16 per hour.
For Veterans
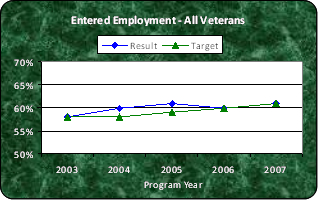
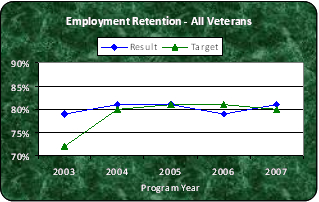
- Entered employment and employment retention rates for all veterans served by One-Stop Career Centers reached 61 percent and 81 percent, respectively.
- Disabled veterans also reached their entered employment and employment retention targets with outcomes of 57 percent and 80 percent, respectively — notable results, considering their significant barriers to employment.
For more specific information, see the Performance Goal narratives.
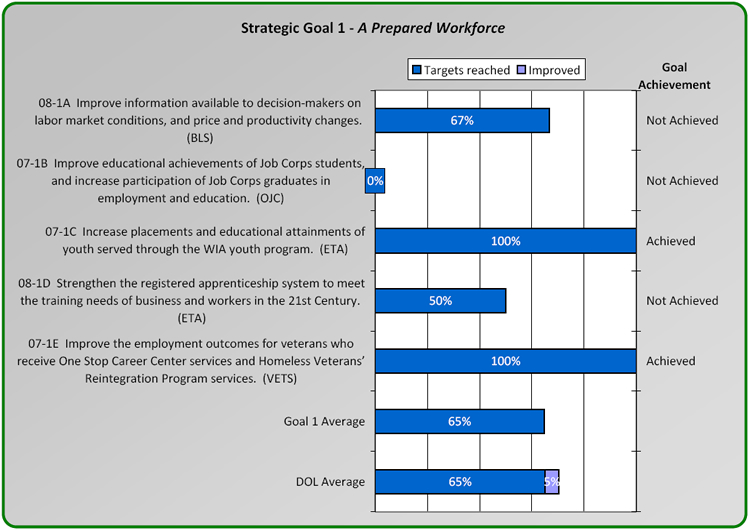
The chart below presents FY 2008 achievements as measured by performance goals and indicators. The performance goal number, goal statement, and responsible agency appear on the left axis, the total percentage of indicator targets reached or improved is indicated in the horizontal bars, and the goal result is on the right axis. Corresponding strategic goal and DOL-wide averages are presented at the bottom of the chart. If the goal is achieved, the bar will run all the way across because, by definition, all indicator targets were reached. If the goal is substantially achieved, the total can range from 80 percent to 100 percent and includes indicators for which the target was not reached, but results improved over the previous year.
As indicated in the chart above, DOL had five performance goals under Strategic Goal 1 in FY 2008, of which two were achieved (40 percent) — below the Department-wide average of 50 percent. BLS did not achieve its goal; only four of its six targets were reached. Job Corps did not reach any of its targets for placement in employment or education; credential attainment; and literacy or numeracy gains. The WIA Youth Program, which uses the same measures but has different targets, achieved its goal by reaching targets for placement and student academic attainment; baseline data were also collected for the literacy/numeracy measure. The Office of Apprenticeship did not achieve its goal; the employment retention target was reached, but not the average hourly wage gain target. VETS' goal was achieved; targets for all four of the indicators for which they had data were reached.
Over the last few years, Job Corps and the WIA Youth program have implemented the Federal job training program common measures for youth.21 These measures reflect shared outcome goals and facilitate comparison for management purposes. The charts below provide results to date for both programs. Although both programs target out-of-school and at-risk youth, the results for the three indicators may continue to differ because of the distinct design of each program. One is primarily a longer-term residential program, while the other provides services to youth in their communities. Also, they have followed different common measures implementation trajectories. For more detailed discussion, see each program's performance goal narrative in the pages that follow.
The table below provides net costs for all performance goals and indicators associated with this strategic goal.22 Those with labels that begin with "07" operate on a Program Year (PY) basis, and are reporting on the period from July 1, 2007 to June 30, 2008 due to the forward funding authorized in the Workforce Investment Act of 1998.
Goal or Indicator
|
Net Costs ($Millions) 23 |
FY 2006
PY 2005 |
FY 2007
PY 2006 |
FY 2008
PY 2007 |
Strategic Goal 1: A Prepared Workforce |
$3,360 |
$3,267 |
$3,464 |
Performance Goal 08-1A (BLS)
Improve information available to decision-makers on labor market conditions, and price and productivity changes. |
573 |
574 |
574 |
Percent of output, timeliness, accuracy, and long-term improvement targets achieved for labor force statistics |
— |
268 |
276 |
Percent of output, timeliness, accuracy, and long-term improvement targets achieved for prices and living conditions |
— |
198 |
192 |
Percent of output, timeliness, accuracy, and long-term improvement targets achieved for compensation and working conditions |
— |
95 |
92 |
Percent of output, timeliness, accuracy, and long-term improvement targets achieved for productivity and technology |
— |
12 |
13 |
Customer satisfaction with BLS products and services (e.g., the American Customer Satisfaction Index) |
— |
0 |
0 |
Cost per transaction of the Internet Data Collection Facility |
— |
1 |
1 |
Dollars not associated with indicators |
573 |
— |
— |
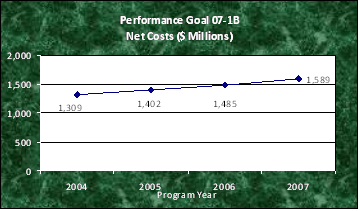
Performance Goal 07-1B (Job Corps)
Improve educational achievements of Job Corps students and increase participation of Job Corps graduates in employment and education. |
1,402 |
1,485 |
1,589 |
Percent of participants entering employment or enrolling in post-secondary education or advanced training/occupational skills training in the first quarter after exit |
1,402 |
1,485 |
1,589 |
Percent of students who attain a GED, high school diploma or certificate by the end of the third quarter after exit |
Percent of students who achieve literacy or numeracy gains of one Adult Basic Education (ABE) level |
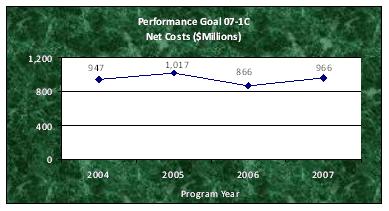
Performance Goal 07-1C (WIA Youth)
Increase placements and educational attainments for youth served through the WIA youth program. |
1,017 |
866 |
966 |
Percent of youth who enter employment or the military or enroll in post secondary education and/or advanced training/occupational skills training in the first quarter after exit |
1,017 |
866 |
966 |
Percent of students who attain a GED, high school diploma, or certificate by the end of the third quarter after exit |
Percent of students who achieve literacy or numeracy gains of one Adult Basic Education (ABE) level |
Performance Goal 08-1D (Apprenticeship)
Improve the registered apprenticeship system to meet the training needs of business and workers in the 21st Century. |
25 |
24 |
25 |
Percent of those employed nine months after registration as an apprentice |
25 |
24 |
25 |
Average hourly wage gain for tracked entrants employed in the first quarter after registration and still employed nine months later |
Performance Goal 07-1E (VETS Employment Services)
Improve the employment outcomes for veterans who receive One-Stop Career Center services and Homeless Veterans' Reintegration Program (HVRP) services. |
212 |
211 |
221 |
Percent of Veteran participants employed in the first quarter after exit |
89 |
90 |
93 |
Percent of Veteran participants employed in the first quarter after program exit still employed in the second and third quarters after exit |
Percent of Disabled Veteran participants employed in the first quarter after exit |
89 |
90 |
95 |
Percent of Disabled Veteran participants employed in the first quarter after exit still employed in the second and third quarters after exit |
Entered employment rate for homeless veteran HVRP participants |
30 |
29 |
31 |
Employment retention rate after 6 months for homeless veteran HVRP participants |
Dollars not associated with indicators |
4 |
2 |
2 |
Other (Youth Offender Reintegration, Indian and Native American Youth Programs, etc.) |
131 |
107 |
89 |
Improve information available to decision-makers on labor market conditions, and price and productivity changes.
Performance Goal 08-1A (BLS)
Indicators, Targets and Results
*Indicator target reached (Y), improved (I), or not reached (N) |
FY 2006
Goal Not Achieved |
FY 2007
Goal Achieved |
FY 2008
Goal Not Achieved |
Percent of output, timeliness, accuracy, and long-term improvement targets achieved for labor force statistics |
Target |
85% |
80% |
92% |
Result |
79% |
92% |
86% |
* |
N |
Y |
N |
Cost |
— |
$268 |
$276 |
Percent of output, timeliness, accuracy, and long-term improvement targets achieved for prices and living conditions |
Target |
85% |
90% |
90% |
Result |
94% |
90% |
92% |
* |
Y |
Y |
Y |
Cost |
— |
$198 |
$192 |
Percent of output, timeliness, accuracy, and long-term improvement targets achieved for compensation and working conditions |
Target |
85% |
86% |
96% |
Result |
77% |
96% |
96% |
* |
N |
Y |
Y |
Cost |
— |
$95 |
$92 |
Percent of output, timeliness, accuracy, and long-term improvement targets achieved for productivity and technology |
Target |
85% |
86% |
100% |
Result |
100% |
100% |
71% |
* |
Y |
Y |
N |
Cost |
— |
$12 |
$13 |
Customer satisfaction with BLS products and services per the American Customer Satisfaction Index |
Target |
75% |
79% |
79% |
Result |
79% |
79% |
82% |
* |
Y |
Y |
Y |
Cost |
— |
$0 |
$0 |
Cost per transaction of the Internet Data Collection Facility |
Target |
$2.58 |
$1.79 |
$1.11 |
Result |
$1.82 |
$1.12 |
$0.76 |
* |
Y |
Y |
Y |
Cost |
— |
$1 |
$1 |
Goal Net Cost (millions) |
$573 |
$574 |
$574 |
Source(s): Office of Publications and Special Studies report of release dates against OMB release schedule for BLS Principal Federal Economic Indicators, News releases for each Principal Federal Economic Indicator, BLS budget submissions and Quarterly Review and Analysis System, ACSI Quarterly E-Government scores.
Note: Costs for this goal are net costs as defined in a footnote to the Cost of Results discussion in Management's Discussion and Analysis.
Program Perspective and Logic
The Bureau of Labor Statistics is the principal fact-finding agency in the Federal government in the broad field of labor economics. As an independent national statistical agency within the Department of Labor, BLS collects, processes, analyzes, and disseminates essential statistical data to the American public, the U.S. Congress, other Federal agencies, State and local governments, business, and labor. BLS provides information that supports the formulation of economic and social policy, and decisions that affect virtually all Americans.
BLS reports performance for this goal by aggregating the underlying performance measures of output, timeliness, accuracy, and long-term improvement for its statistical programs into four comprehensive performance indicators. BLS demonstrates continuous improvement by setting more ambitious targets on its indicators. In addition, the performance measures that underlie those indicators encompass enhancements to BLS products. Examples of these enhancements include new price indexes for four specialty trade contractors, and the addition of three new countries (Argentina, Slovakia, and the Philippines) to the BLS manufacturing series.
BLS measures customer satisfaction with its Occupational Outlook Handbook (OOH) Web page (www.bls.gov/OCO/), a nationally recognized source of career information. OOH is one of the most frequently used BLS Web pages, and the performance indicator allows BLS to assess enhancements and identify potential areas for further improvement. In addition, BLS reports on the efficiency of its Internet Data Collection Facility (IDCF), a single, secure architecture that BLS surveys use to collect information from respondents online. IDCF is an important tool for offering a wider range of reporting options to respondents, as well as a more economical means of data collection.
To generate the highest yields for their clients, investment firms must be able to reliably anticipate market movements. Jeff works as Chief Economist for a money management firm that manages portfolios for both institutional and individual investors. Jeff uses the BLS Employment Situation and other BLS Labor Force Statistics data to get a macroeconomic view of the economy to help guide his investment decisions. In particular, Jeff recently used data from the Job Openings and Labor Turnover Survey (JOLTS) to examine labor market churn and wage inflation. Sector-specific data are particularly useful to Jeff as he analyzes the different sectors of the economy. The JOLTS data assist Jeff in his economic research and Federal Reserve analysis. BLS statistics help Jeff manage his portfolios and anticipate labor market movements throughout the business cycle.
[Photo credit: Horizon Investments, LLC] |
 |
Analysis and Future Plans
BLS reached targets for four of its six performance indicators. BLS reached 86 percent of the underlying targets for its labor force statistics indicator, missing the target by six percentage points. The Current Employment Statistics (CES) and Local Area Unemployment Statistics programs did not reach their timeliness targets because the September 2007 Metropolitan Area Employment and Unemployment news release, which includes data from both programs, was issued a few minutes late due to a systems error. The CES program also missed a workload measure target because BLS released fewer series than planned due largely to confidentiality and reliability reviews. In addition, the Quarterly Census of Employment and Wages program missed one of its workload targets because business establishment growth was lower than projected.
BLS reached 71 percent of the underlying targets for its productivity and technology indicator, missing the target by 29 percentage points. The Major Sector Productivity program missed its timeliness target because a Productivity and Costs news release was delayed to correct an error in the text. The Industry Productivity program also missed its workload measure due to discontinuation of 32 productivity-related measures for four manufacturing industries.
BLS reached 92 percent of the underlying targets for its prices and living conditions indicator, exceeding its target by two percentage points. The International Price Program missed two workload targets, and the Consumer Expenditure Survey missed one workload target. BLS reached 96 percent of the underlying targets for its compensation and working conditions indicator. The Census of Fatal Occupational Injuries missed its accuracy measure due largely to delays in obtaining data from one State.
Using the American Customer Satisfaction Index survey to measure the OOH Web page, BLS exceeded its target of 79 percent. BLS also exceeded its target for decreasing the cost per transaction of its IDCF. The cost per transaction of $0.76 in FY 2008 decreased from $1.12 in FY 2007, and surpassed the target of $1.11.
Costs associated with this performance goal were virtually unchanged from FY 2007-08.
PART, Program Evaluations and Audits
PART Year |
Rating |
PART Findings and Improvement Plan:
http://www.whitehouse.gov/omb/expectmore/
summary/10000326.2003.html |
2003 |
Effective |
FY 2008 Progress on PART Improvement Plan |
- Conducting an independent evaluation on how the agency is improving its effectiveness in meeting the needs of its data users. The evaluation proposal was approved in April 2008. However, BLS is deferring the evaluation until 2009 due to budget constraints. BLS will prepare a statement of work by March 2009.
- Developing additional efficiency and cost-effectiveness measures to demonstrate ongoing program improvement. BLS continues to report on its cost per transaction of the IDCF. BLS added an efficiency measure in the 2009 budget to reduce the cost per housing unit initiated in the Consumer Price Index (CPI) as part of a plan to implement a more representative and current sample of geographic areas, as well as a continuously updated housing sample in the CPI. BLS is developing a new efficiency measure for FY 2010.
- Establishing more ambitious targets for its long term and annual performance measures to drive continued improvement. BLS regularly reviews its targets to promote continuous improvement. For example, in 2007, BLS added new Business Employment Dynamics series at the State level. Between 2006 and 2007, BLS accelerated the release of selected SOII data by four months, and added three countries to its International Comparisons series. In 2007, and again in 2008, BLS raised the targets for several of its performance indicators.
|
"Customer Satisfaction with the BLS Occupational Outlook Handbook (OOH) Website" September 2008
(Federal Consulting Group) |
Relevance: As BLS continues to provide more information to customers on its Web site, it is important to know how satisfied customers are with the delivery of BLS products and services. Improvements to the OOH portion of the BLS Web site in areas such as search or navigation can increase the usefulness of the Web site to BLS customers. |
Findings and Recommendations:
- BLS received a customer satisfaction score of 82 percent for 2008. Results from the OOH customer satisfaction survey suggest better search, navigation, and site performance could improve overall customer satisfaction.
|
Next Steps:
- As the culmination of a multiyear improvement effort, BLS launched an enhanced Web site in July 2008 that was redesigned with feedback from customers, including the OOH customer satisfaction survey results. The redesigned BLS Web site, which includes the OOH page, offers improved navigation as user-tested menus enable faster and more efficient browsing, and improved search capability by upgrading to a new search engine. These improvements will enhance OOH customer experience.
|
Additional Information: A copy of the quarterly news release can be found at http://www.foreseeresults.com/_downloads/acsicommentary/ACSI_EGov_Report_Q3_2008.pdf. |
Data Quality and Top Management Challenges
Data quality for this performance goal is rated Excellent.24 BLS has instituted rigorous, systematic, and comprehensive controls to ensure that the data quality retains its Excellent rating. The data are highly relevant; the BLS executive team meets with program management on a quarterly basis to discuss progress toward meeting performance indicators. BLS also conducts its own program reviews and contracts for external reviews, as necessary. These assessments ensure that survey data are accurate, reliable, and released in a timely fashion; systems and procedures are documented adequately; program performance meets or exceeds standards; and pre-release data are kept confidential.
Improve educational achievements of Job Corps students and increase participation of Job Corps graduates in employment and education.
Performance Goal 07-1B (OJC)
Indicators, Targets and Results
*Indicator target reached (Y), improved (I), or not reached (N)
|
PY 2004
Goal Not Achieved |
PY 2005
Goal Not Achieved |
PY 2006
Goal Not Achieved |
PY 2007
Goal Not Achieved |
Percent of participants entering employment or enrolling in post-secondary education or advanced training/occupational skills training in the first quarter after exit |
Target |
85% |
85% |
87% |
82% |
Result |
84% |
80% |
74% |
73% |
* |
N |
N |
N |
N |
Percent of students who attain a GED, high school diploma or certificate by the end of the third quarter after exit |
Target |
64% |
64% |
65% |
64% |
Result |
64% |
60% |
57% |
53% |
* |
Y |
N |
N |
N |
Percent of students who will achieve literacy or numeracy gains of one Adult Basic Education (ABE) level (approximately equivalent to two grade levels) |
Target |
45% |
45% |
58% |
58% |
Result |
47% |
58% |
58% |
53% |
* |
Y |
Y |
Y |
N |
Goal Net Cost (millions) |
$1,309 |
$1,402 |
$1,485 |
$1,589 |
Source(s): Job Corps Management Information System.
Legacy Data: Some indicators not shown for PY 2004. Complete indicators, targets and results for PY 2001-04 are available in the FY 2006 report at /_sec/media/reports/annual2006/PGD.htm. See Performance Goal 05-1.1B.
Note: Costs for this goal are net costs as defined in a footnote to the Cost of Results discussion in Management's Discussion and Analysis. Costs for PY 2006 have been restated since publication of the FY 2007 Performance and Accountability Report to correct improper inclusion of $198 million in revenue and apply a more accurate means of splitting grant costs. Costs are not allocated to the indicator level for placement, credential and literacy/numeracy measures because program activities are not separable into categories associated with one or another.
Program Perspective and Logic
Job Corps is an intensive educational and vocational training program (primarily residential) for economically disadvantaged youth ages 16 through 24 who often face multiple barriers to gainful employment. This program provides career counseling, technical skills and academic training, social education, and other support services, such as housing, transportation and family support resources to more than 60,000 individuals at 122 centers nationwide. Job Corps centers, ranging in size from 200 to 2,000 students, are located in both urban and rural communities. Job Corps centers provide individually tailored services to help students achieve the skills and credentials required to be successful, productive citizens and to obtain work opportunities that lead to long-term employment.
Job Corps' performance can be influenced by external factors such as local labor market conditions and national economic trends. In recent years, an increasingly knowledge-based labor market has challenged Job Corps to revise its training strategies. In response, Job Corps developed and has begun to implement its New Vision, an approach that focuses on applied academics by increasing the rigor and relevance of academic and career technical training; incorporating industry-based standards and certifications; reinforcing a standards-based curriculum approach; and providing a more comprehensive system of on-center and post-center support services. This approach is providing students with valuable credentials and competitive skills they need to pursue challenging careers — and the timing is critical since recent statistics indicate that national youth unemployment rates are rising. Performance of the Job Corps program is assessed using the Federal job training program common measures for youth — placement in employment or education, attainment of a degree or certificate, and literacy or numeracy gains — as indicators of student achievement in improving their long-term employability.
Analysis and Future Plans
Job Corps' performance was significantly below the desired outcomes for all three indicators. Placement of Job Corps graduates and former enrollees in employment, the military or post-secondary education mirrored the national employment picture and declined in PY 2007. The result of 73 percent is far below the 82 percent target but just one percentage point lower than the PY 2006 result. Job Corps attributes its National Certification Initiative, which increased emphasis and rigor for career technical training programs, for the impact on the PY 2007 certificate attainment rate; the result of 53 percent is four points lower than last year and 11 points below the target. Job Corps anticipates that the more stringent requirements for career technical training completion will continue to affect the results of the certificate attainment rate as all necessary support structures for the Certification Initiative — which would assist more students with successful completion of their training program — have not yet been fully implemented. This in turn will temporarily affect the placement rate, as a decreased graduation rate leads to a larger proportion of non-graduating former enrollees. Former enrollees traditionally have a lower placement rate than graduates because they have not attained the qualifications (educational or career technical training) that would make them more competitive in the labor market. Also, non-graduating former enrollees' placement window, the period during which placement assistance is offered and placement data are captured, is just 90 days, versus the six-month window for graduates. Job Corps expects PY 2008 performance indicator results to continue the downward trend, although changes are expected to be small — a few percentage points.
Like many young people, Alison didn't recognize the value of education — until she came to Job Corps. With focus and hard work, Alison graduated from Job Corps in 2007, earning a high school diploma and a certificate in accounting. She currently works as a Federal civilian employee, processing national invoices and regional tort claims for Job Corps' National Office. Above, Alison consults with Margaret Carson, Division Chief, Budget and Facilities Support. Alison credits her Job Corps classroom and work-based learning experiences with helping her develop the organizational, communication, and data entry skills that prepared her for the position. Alison also recognizes opportunity when she sees it, which is why — thanks to her employee benefits package — she is currently enrolled in a business management class at Southeastern University. Alison now gives back by speaking with friends and other young people who are interested in Job Corps.
[Photo credit: Peni Webster] |
 |
Literacy/numeracy gains were also lower than expected; the PY 2007 result of 53 percent was five percentage points short of the target and PY 2006 result of 58 percent. Literacy/numeracy gains may not recover, either, in part due to a continued adjustment from paper/pencil to the online version of the Test for Adult Basic Education — a diagnostic test used by Job Corps to determine skill levels and aptitudes. Finally, implementation of the New Vision focus on applied academics is expected to continue to impact students' learning gains.
To curb early departures, most often due to violations of Zero Tolerance policy against drugs and violence or to the inability of students to adjust to the residential nature of the program, Job Corps is continuing to explore the impact of initiatives designed to improve the program's results:
- Career Success Standards is a set of eight behavioral effectiveness standards for personal and workplace competencies that seem to be positively impacting center culture, address student retention and career preparation, and prepare students with the soft skills employers now demand of their employees;
- The Speakers, Tutors, Achievement, Retention and Success (STARS) initiative appears to be increasing students' academic achievement, career skills attainment, and retention in the program by providing motivational speakers, and highly qualified tutors and mentors to assist them with academics, career technical training and personal and social development; and
- Pre-employment Drug Testing Pilot identifies random samples of applicants who are screened for drugs prior to enrollment. Program research shows that testing positive on the initial drug test is a reliable predictor of students separating from the program due to Zero Tolerance infractions.
In addition, Job Corps is working to expand services to English Language Learners in an effort to increase successful outcomes for students across the country with limited English proficiency. Plans also include improving services to students with cognitive disabilities. Specifically, Job Corps has made periodic updates to its data collection system to improve tracking of students with disabilities. Upon the applicant's disclosure of a disability and subsequent request for accommodation, Outreach Admissions counselors seek guidance from both the Regional Disability Coordinator and qualified personnel on how to best accommodate the student's needs. During PY 2008, Job Corps will convert the part-time Regional Disability Coordinators to full-time.
Costs associated with this performance goal increased by seven percent from PY 2006-07. The following factors contributed to this increase: higher utility and heath care costs, salary increases and adjustments for academic and career technical training instructors, and additional unforeseen costs associated with expansion of the program to include a new Job Corps Center.
PART, Program Evaluations and Audits
PART Year |
Rating |
PART Findings and Improvement Plan:
http://www.whitehouse.gov/omb/expectmore/
summary/10002372.2007.html |
2007 |
Adequate |
FY 2008 Progress on PART Improvement Plan |
- Exploring opportunities to improve cost effectiveness and performance outcomes at the 28 non-DOL owned properties which are operated for Job Corps by the Departments of Agriculture and Interior. The US Department of Agriculture (USDA) and DOL have a new Interagency Agreement with increased provisions for oversight of the program and financial management of the Job Corps Civilian Conservation Centers (CCC). The National Office has provided a number of Webinars, regional conferences and one-on-one technical assistance for all centers to assist them in improving program performance. The Job Corps Regional Directors have improved communications with the Forest Service National Headquarters staff to quickly identify and address programmatic issues. DOL is conducting an audit of USDA and DOI PY 2006 expense reporting and accounting procedures for center operating and construction funds.
- Improving the tracking and reporting of Job Corps facility conditions and using the data to inform resource allocation decisions regarding improvements and maintenance. In an effort to support the goals and objectives of both the President's Real Property Asset Management Initiative and the Department's Asset Management Plan, Job Corps has implemented extensive improvements to the real property data systems. Improvements have included incorporating performance information (condition index, mission dependency, and utilization) into the decision-making process and developing a demolition project recommendation process. The property inventory has documented a steady improvement in facility condition. The Department, mainly as a result of these Job Corps activities, achieved green status on the Administration's Real Property scorecard in the 2nd quarter of FY 2008 and continues to achieve its goals.
- Adopting efficiency measures that are linked to performance outcomes, account for all costs, and facilitate comparisons across Department of Labor training and employment programs. Job Corps has contracted with a technical expert familiar with DOL's cost accounting systems to analyze both the merits and shortcomings of the method for measuring Job Corps' cost-effectiveness and efficiency; a draft report with revised efficiency measures that will capture the unique characteristics of the portfolio of Job Corps outcomes is expected by the end of 2008. In the meantime, Job Corps is working to improve efficiency results via energy reduction investment and commodity purchase, and fleet and telephone line reduction, and has already realized cost savings and cost avoidance of approximately $5 million annually.
|
"Performance Audit of the Cleveland Job Corps Center," September 2007 (Office of Inspector General) |
Relevance: The Office of Inspector General (OIG), as part of its ongoing review of Job Corps Centers and their operators, conducted this audit to determine if the operator complied with laws, regulations and contract provisions in its reported performance measures and financial operations. |
Findings and Recommendations:
- The Center operator did not 1) properly reconcile Public Vouchers submitted for payment with expenses reported on Financial Reports as required, 2) properly obtain consulting services, or 3) maintain a record of the services received.
- The OIG recommended that Job Corps develop an oversight process requiring contractors to reconcile differences between amounts recorded on Public Vouchers and reported expenses and that Job Corps train personnel monitoring Center financial activities.
|
Next Steps:
- Job Corps established a new Financial Management workgroup to review current policies and identify areas that need revision.
- The National Office of Job Corps conducts annual Program Managers' training which includes contract oversight and financial management training.
- The Chicago Regional Office has initiated the process to recover liquidated damages.
|
Additional Information: The report is available at http://www.oig.dol.gov/public/reports/oa/2007/26-07-003-01-370.pdf. |
"Performance Audit of the Laredo Job Corps Center," September 2007 (OIG) |
Relevance: The assigned audit of the Laredo Job Corps Center was conducted to determine if the operator complied with laws, regulations and contract provisions in its reported performance measures and financial operations. |
Findings and Recommendations:
- Center officials did not reporting student attendance as required and as a result, overstated the On Board Strength (OBS); it was recommended that Job Corps recover liquidated damages for overstating OBS.
- The OIG also found that Center officials did not comply with Job Corps' admission requirements (background checks were not routinely performed).
|
Next Steps:
- The Dallas Regional Office has requested that the Laredo center operator reconcile bed check reports and rosters.
- The Dallas Regional Office has initiated the process to recover liquidated damages.
- The National Office of Job Corps issued a PRH Change Notice to provide guidance on conducting and documenting background checks.
|
Additional Information: The report is available at http://www.oig.dol.gov/public/reports/oa/2007/09-07-002-01-370.pdf. |
Data Quality and Top Management Challenges
Data quality for this performance goal is rated Very Good.25 When the OIG cited insufficient management controls over performance data in 2004, DOL designed and implemented new data integrity procedures which require regional offices to utilize targeted samples (highlighting where error or manipulation may have occurred) for audit reviews conducted in conjunction with on-site assessments. When Regional Offices find that Center operators have not complied with contractual obligations, liquidated damages are identified and assessed. Since 2004, $585,397 in liquidated damages have been recovered. The Office of Job Corps is confident that the new data integrity strategy is producing more reliable student outcome data from Job Corps centers and career transition service providers.
To address Ensuring the Effectiveness of the Job Corps Program (see the Top Management Challenges section of Management's Discussion and Analysis), DOL is improving the way Regional Offices monitor the performance of contractors that operate 94 of its Job Corps centers. In FY 2007, a new process that included both a fiscal and a performance review was implemented. Over a one-year period all six Regional Offices received specialized training on monitoring contractor performance of financial management and cost reporting, data integrity, and asset management. The Departments of Interior and Agriculture operate the remaining 28 Job Corps centers via Interagency Agreements with DOL. In March 2008, a new Interagency Agreement was signed with USDA — which requires Agriculture to be more accountable for the funds transferred to them and allows DOL the flexibility it needs to operate the centers. In addition, effective July 1, 2008, the three centers formerly operated by the National Park Service were transferred to the USDA's Forest Service.
Increase placements and educational attainments for youth served through the WIA Youth program.
Performance Goal 07-1C (ETA)
Indicators, Targets and Results
| *Indicator target reached (Y), improved (I), or not reached (N)
**Estimated |
PY 2005
Goal Achieved |
PY 2006
Goal Achieved |
PY 2007
Goal Achieved |
Percent of participants entering employment or enrolling in post-secondary education or advanced training/occupational skills training in the first quarter after exit |
Target |
baseline |
60% |
61% |
Result |
57.8% |
60% |
67%** |
* |
Y |
Y |
Y |
Percent of students who attain a GED, high school diploma or certificate by the end of the third quarter after exit |
Target |
baseline |
40% |
45% |
Result |
36% |
44% |
57%** |
* |
Y |
Y |
Y |
Percent of students who achieve literacy or numeracy gains of one Adult Basic Education (ABE) level (approximately equivalent to two grade levels) |
Target |
— |
baseline |
baseline |
Result |
— |
— |
31%** |
Goal Net Cost (millions) |
$1,017 |
$866 |
$966 |
Source(s): Annual State WIA performance reports (ETA-9091).
Legacy Data: Some indicators not shown for PY 2001-04. Complete indicators, targets and results for PY 2001-04 are available in the FY 2006 report at /_sec/media/reports/annual2006/PGD.htm. See Performance Goal 05-1.1A.
Note: Net costs are defined in a footnote to the Cost of Results discussion in Management's Discussion and Analysis. Costs are not allocated to the indicator level for placement, credential and literacy/numeracy measures because program activities are not separable into categories associated with one or another. This goal was reported Substantially Achieved in the FY 2007 PAR based on estimated data.
Program Perspective and Logic
The Workforce Investment Act authorizes services to low-income youth (age 14-21) with barriers to employment. The program serves both in- and out-of-school youth, including youth with disabilities and other youth who may require specialized assistance to complete an educational program or to secure and hold employment. Youth are prepared for employment and post-secondary education by stressing linkages between academic and occupational learning. Services available to youth include tutoring, alternative schools, summer employment, occupational training, work experience, leadership development, mentoring, counseling, supportive services such as assistance with child care and housing, and follow-up services such as on-going career counseling after a youth exits the program.
DOL collects data for three performance indicators, all Federal job training program common measures for youth that enable the program to describe and compare the outcomes of its core purposes to other education, employment and job training programs. The first measure, percent of youth participants who are in employment or enrolled in post-secondary education or training, indicates whether DOL is transitioning youth into the workforce or post-secondary education — a key to successful careers. The second, percent of participants who attain a diploma, GED, or certificate, is a proxy for the effectiveness of the program in preparing youth participants to compete in the 21st century economy. The third indicator measures literacy/numeracy gains by out-of-school youth participants who are deficient in basic skills. Progam Year 2007 is the first full year in which complete data on this measure is available for analysis. DOL will use the PY 2007 data as a baseline to establish targets for PY 2008.
Analysis and Future Plans
The WIA Youth program achieved its performance goal in PY 2007. The program exceeded its placement in employment or education target by six percentage points and surpassed the degree or certificate attainment target by twelve percentage points. Both results represent improvement over PY 2006; they are noteworthy achievements in light of the program's increasing services to the neediest youth, including out-of-school youth — populations that are difficult to serve and historically have low performance outcomes.
The Department will continue to implement strategies that recognize out-of-school and at-risk youth as an important part of the new workforce. WIA youth programs connect these youth with quality secondary and post-secondary educational opportunities, in addition to high-growth and other employment opportunities.
At 17, Maira came to the Wisconsin's Waukesha County Workforce Development Center in 2003 for help with school. She was behind in class and getting poor grades — due in part to major family difficulties. After enrollment in the WIA Youth program, Maira earned a High School Equivalency Diploma (HSED) and prepared for college. A summer work experience with the Waukesha Police Department convinced Maira to pursue a career in police science. While attending Waukesha County Technical College, Maira gave birth to a baby girl (Isabella) and still completed that semester with good grades. In May 2007, Maira graduated with a criminal justice degree and was selected to attend the Recruit Academy at Milwaukee Area Technical College for a 13 week training program. After completing the training program, she accepted an officer position with the Fond du Lac Police Department with a starting wage of $19.00/hour.
[Photo credit: DOL/ETA] |
 |
In 2006, DOL formed the Shared Youth Vision (SYV) Federal Partnership with the Departments of Health and Human Services, Education, Justice, Housing and Urban Development and Transportation, plus the Social Security Administration and the Corporation for National and Community Service. The Partnership assists States in coordinating resources and program delivery strategies to achieve positive outcomes for the neediest youth. DOL and the SYV Federal Partnership have continued to work with the 16 SYV Pilot States that were awarded funds in 2006 to develop and implement projects that integrate services for specific populations of the neediest youth. Through a peer-to-peer mentoring initiative, the Pilot States are sharing knowledge and best practices on serving the neediest youth with 12 non-pilot States.
Costs associated with this performance goal rose by seven percent from PY 2004-05, fell 15 percent between PY 2005-06, then rose again by 12 percent from PY 2006-07, reflecting fluctuation in the timing of expenditures; States have three years to expend funds. Annual variations in costs are also attributable to fluctuations in the number of participants served. Costs are not allocated at the indicator level, as funds provided to the States support all the measured outcomes and many of the youth who exit the program experience all three (placement, credentials and literacy/numeracy gains).
PART, Program Evaluations and Audits
PART Year |
Rating |
PART Findings and Improvement Plan:
http://www.whitehouse.gov/omb/expectmore/
summary/10000342.2008.html |
2008 |
Adequate |
FY 2008 Progress on PART Improvement Plan |
- Strengthen accountability for employment outcomes and skill attainment by adopting common performance measures and targets to allow for comparisons with other Federal job training programs. DOL developed a preliminary estimate in PY 2007 for the literacy/numeracy measure, the last of the common measures to be fully implemented. Based on this estimate, DOL will establish targets for PY 2008.
- Conducting an evaluation to determine WIA services' impact on employment and earnings outcomes for participants. In June 2008, DOL awarded a contract to conduct a rigorous, long-term impact evaluation of WIA programs.
- Adopting efficiency measures that are linked to performance outcomes, account for all costs, and facilitate comparisons across Department of Labor training and employment program. A final report of the efficiency measure study with recommendations for appropriate outcome-based efficiency measures for DOL's employment and training programs will be completed by December 2008. The selected measure or measures will be implemented during Program Year 2009.
|
"Disconnected Youth: Federal Action Could Address Some of the Challenges Faced by Local Programs That Reconnect Youth to Education and Employment," February 2008 (Government Accountability Office) |
Relevance: The Government Accountability Office (GAO) examined the challenges that 39 youth programs face in serving youth, who have disconnected from education and employment, and found that the structure of workforce investment board contracts with local service providers often hinders service to the youth most in need of assistance. |
Findings and Recommendations:
- GAO found that workforce investment board contracts with local service providers often require the providers to achieve performance goals for participants in one-year time frames, which is very challenging for programs serving the most at-risk youth. Since funding in subsequent years is often contingent on meeting performance goals, the contract structure de-incentivizes service to these youth.
- GAO recommended that DOL work with States and workforce investment boards to ensure that they have the information and guidance needed to develop and implement contracts that allow local programs to serve the youth most in need of assistance and meet performance goals.
|
Next Steps:
- DOL convened WIA state, local, and youth service providers in late fall of 2008 to get a better understanding of contracting issues and to gather local examples of contracts that have the components and the flexibility to successfully serve the youth most in need.
- Using input from the discussions with service providers, DOL will issue guidance to the workforce development system by the end of 2008 that will provide specific examples of ways to develop contracts with local service providers that allow them to successfully serve youth at varying skill levels.
|
Additional Information: The report available at http://www.gao.gov/new.items/d08313.pdf. |
"Workforce Development: Community Colleges and One-Stop Centers Collaborate to Meet 21st Century
Workforce Needs," May 2008 (GAO) |
Information on this study is provided in the corresponding table for Performance Goal 07-2A. |
Data Quality and Top Management Challenges
The data quality score for this performance goal also applies to Performance Goals 2A and 2B, which rely on the same data collection system to determine employment outcomes for WIA program participants. Data quality for these performance goals are rated Very Good.26 Data verification remains an area for improvement, and extensive efforts have been directed toward improving data quality through the use of ETA's data validation system and monitoring at both the national and regional levels (see also Improving Performance Accountability of Grants in the Top Management Challenges section of Management's Discussion and Analysis). In particular, the Department provided technical assistance to States on the integration of quality controls into data collection and reporting systems, conducted several regional training sessions and webinars to address technical and policy questions about performance reporting, and issued revised guidance in October 2007 on WIA incentives and sanctions that included data validation results as one of the criteria for determining eligibility for WIA incentive awards. In addition, in PY 2006, revisions to the draft Core Monitoring Guide were made to better address data validation concerns. The Core Monitoring Guide is continually revised to address new issues that arise during site visits. Site visits are conducted to ensure compliance with reporting standards.
Improve the registered apprenticeship system to meet the training needs of business and workers in the 21st Century.
Performance Goal 08-1D (ETA)
Indicators, Targets and Results
*Indicator target reached (Y), improved (I), or not reached (N) |
FY 2005
Goal Achieved |
FY 2006
Goal Achieved |
FY 2007
Goal Achieved |
FY 2008
Goal Not Achieved |
Percent of those employed nine months after registration as an apprentice |
Target |
Baseline |
78% |
79% |
84% |
Result |
78% |
82% |
83% |
84% |
* |
Y |
Y |
Y |
Y |
Average hourly wage gain for tracked entrants employed in the first quarter after registration and still employed nine months later |
Target |
Baseline |
$1.26 |
$1.33 |
$1.51 |
Result |
$1.26 |
$1.32 |
$1.50 |
$0.61 |
* |
Y |
Y |
Y |
N |
Goal Net Cost (millions) |
$23 |
$25 |
$24 |
$25 |
Sources: Registered Apprenticeship Partners Information Data System (RAPIDS) and Registered Apprenticeship Information System (RAIS).
Legacy Data: One indicator for FY 2005 was dropped; it is not included in this table. Complete indicators, targets, and results for FY 2002-05 are available in the FY 2006 report at /_sec/media/reports/annual2006/PGD.htm. See Performance Goal 06-1.1A.
Note: Costs for this goal are net costs as defined in a footnote to the Cost of Results discussion in Management's Discussion and Analysis. "Tracked entrants" is defined as the cohort of apprentices registered and entered into RAPIDS during a given reporting period. The 25 States that have federally registered apprenticeship programs enter data on individuals into the system. Costs are not allocated to the indicator level for retention and earnings measures because program activities are not separable into categories associated with one or the other.
Program Perspective and Logic
Established in 1937, the National Registered Apprenticeship System is a partnership of the Department of Labor, State agencies, sponsors, industry leaders, employers, employer associations, labor and management organizations, and educational institutions. It provides opportunities for jobseekers to secure jobs with career paths, earn competitive wages, and obtain nationally-recognized industry credentials. The apprenticeship training system promotes and registers programs and apprentices, certifies standards, safeguards the welfare of the apprentices, and provides a nationally recognized system for skilled and technical occupational training programs throughout the United States. Apprenticeship programs use a combination of classroom training and on-the-job training under close supervision of a skilled worker to teach apprentices the practical and theoretical requirements of a highly skilled occupation. Most of the training costs are borne by apprenticeship program sponsors.
The Department promotes the apprenticeship training system to potential sponsors and participants and registers and monitors these partners' apprenticeship programs, in some cases via State Apprenticeship Agencies (SAAs) — which are delegated this authority by the Secretary of Labor. SAA's certify that standards are met for quality, fairness, and opportunity, and that apprenticeship programs incorporate appropriately supervised on-the-job learning and occupation-related technical instruction.
As a system based on voluntary industry participation, apprenticeship program performance is directly impacted by external factors such as the wage rates determined by local apprenticeship sponsors and by the demand for skilled and technical labor in local markets. Two performance indicators, "apprentices employed nine months after registration" and "average hourly wage gain for tracked entrants," are used to indicate progress towards program completion and the value of skills obtained.
Analysis and Future Plans
The Apprenticeship system did not achieve its performance goal for FY 2008 since the wage gain target was not reached. The retention result continues a three-year trend of improvement since the baseline was established in FY 2005. While the 61-cent average hourly wage gain (from $15.27 to $15.87) was far below the target of $1.51, it translates to an annual increase of $1,269. The decline in construction associated with a deteriorating housing market had a significant impact on the number of registered apprentices. DOL expects that even fewer apprentices will be registered in the construction industry in FY 2009 and that this will continue to exert downward pressure on retention and average earnings measures of Apprenticeship program performance. Occupational demands are projected to continue shifting toward high growth industries. For example, United Parcel Service recently registered a large number of apprentice truck drivers with higher-than-average starting wages. These apprenticeships also feature above average annual increases that will help offset the expected impact of continued reductions in construction and related industries.
Phillina was on public assistance and struggling to raise her child. She had few skills to secure a livable-wage job when she signed up for construction-readiness training after a presentation by a recruiter from the Women in Apprenticeship and Nontraditional Occupations program, which is co-sponsored by the Office of Apprenticeship and the Women's Bureau. Phillina knew she could do the work, but needed direction and help. She excelled in every class and the hard physical work gave her a strong sense of accomplishment. Phillina participated in the cement mason apprenticeship program, which requires applicants to complete an examination that includes pushing a wheelbarrow with a 100 pound load. She stayed after class every day to practice, passed the test and graduated first in her class of 75 candidates. Phillina is now working full-time — earning over $16 per hour plus benefits — and looking for an apartment to move out of transitional housing. With the assistance of the Office of Apprenticeship and her dedication and perseverance, Phillina is well on her way to providing a better life for herself and her child.
[Photo credit: Johanna Chestnutt] |
 |
To improve performance, the Department is seeking changes to existing apprenticeship standards that would measure apprentices' attainment of certain skills and competencies in addition to using the traditional, time-based approach. Also, DOL will continue providing technical assistance to Women in Apprenticeship and Non-Traditional Occupations (WANTO) grantees, a new consortium that is training over 200 women apprentices.
In order to measure outcomes after apprentices have completed the program, the Office of Apprenticeship is converting to the common measures and will baseline its performance indicators in FY 2009. Therefore, the Apprenticeship program will not appear in the FY 2009 Annual Performance and Accountability Report, but will return in the FY 2010 Annual Performance and Accountability Report.
Two evaluations will be completed in FY 2009. Evaluation of Apprenticeship involves surveys of registered apprenticeship sponsors and visits to five States to determine sponsor views and the costs and benefits of apprenticeship, types of data maintained, linkages with the One-Stop service delivery system, and administration of the apprenticeship system. Retrospective Look at Apprenticeship includes a review of modernization policies that the Office of Apprenticeship has implemented and examines their implications on the future of the program.
Costs associated with this performance goal remained fairly constant from FY 2005-08. Costs are not allocated to the performance indicator level, as funding supports both measured outcomes for apprentices served by the federally administered programs.
PART, Program Evaluations and Audits
PART Year |
Rating |
PART Findings and Improvement Plan:
http://www.whitehouse.gov/omb/expectmore/
summary/10003901.2005.html |
2005 |
Results Not Demonstrated:
Reflecting lack of data on the common measures |
FY 2008 Progress on PART Improvement Plan |
- Implementing the common measures for earnings and retention and establishing an Internet-based apprenticeship registration system to efficiently obtain comprehensive performance data. The Registered Apprenticeship Partners Information Data System (RAPIDS) debuted in November 2007. Phase 2 of RAPIDS is scheduled for completion in FY 2009 and will allow SAAs and sponsors to upload data electronically. Final proposed revisions to the regulations of the National Apprenticeship Act implementing the common measures were published on October 29, 2008. Interim common performance measure data are being gathered through an agreement with the State of Kansas.
- Evaluating and reporting participants' employment and earnings after they leave the program to compare apprenticeship program outcomes with those of other training models. In September 2008, the Office of Apprenticeship received initial data for apprentices who completed their apprenticeship training. The Office of Apprenticeship will analyze these data and develop performance targets during FY 2009.
- Addressing underrepresentation of women in apprenticeship programs through a reinvigorated Equal Employment Opportunity review process and tracking and reporting performance. Three additional WANTO grants were awarded in FY 2008 to recruit, train, employ, and retain women in registered apprenticeship programs in the construction industry. Progress reports from the three FY 2007 WANTO grant recipients were evaluated to determine the success of grantees in achieving the goal of employing women in non-traditional apprenticeship occupations, and best practices that can be shared with the apprenticeship community.
- Adopting efficiency measures that are linked to performance outcomes, account for all costs, and facilitate comparisons across Department of Labor training and employment programs. A final report of the efficiency measure study with recommendations for appropriate outcome-based efficiency measures for DOL's employment and training programs will be completed by December 2008. The selected measure or measures will be implemented in Fiscal Year 2010.
|
Data Quality and Top Management Challenges
Data quality for the Apprenticeship program is rated Fair.27 All Federally-administered programs (in 25 States) participate in RAPIDS. RAPIDS established greater quality controls to ensure timely, complete, and valid data are collected from the program sponsors that utilize the system. Verification testing of RAPIDS was completed in the 3rd Quarter of FY 2008 with no major findings. Additional testing is scheduled for completion at the end of FY 2009. Revisions to the regulations to the National Apprenticeship Act that address the quality, flexibility, evaluation and performance data requirements of Apprenticeship programs were published on October 29, 2008.
As noted in the Analysis and Future Plans section, the Apprenticeship program will be converting to the common measures in FY 2009. By March 2009, the Office of Apprenticeship will have three quarters (Quarter 4, FY 2006; and Quarters 1 and 2, FY 2007) of data for the common measures to develop baseline performance targets. The transition to common measures is scheduled to coincide with the availability of unemployment insurance wage record data from the Wage Record Interchange System, which will be matched against apprenticeship data to determine performance outcomes. The methodology for calculating the common performance measures will further mirror and align apprenticeship results with those used for other DOL employment and training programs.
RAPIDS implementation also addresses Improve Apprenticeship Data Quality (see the Top Management Challenges section of Management's Discussion and Analysis) by developing a cost-effective strategy for collection of data from programs in 25 States and three territories that are not administered by the Department. DOL's oversight of the Federally-administered State programs to ensure compliance with Federal guidelines and regulations continues, as recommended by the Government Accountability Office (GAO-05-886).
Improve employment outcomes for veterans who receive One-Stop Career Center services and Homeless Veterans' Reintegration Program services.
Performance Goal 07-1E (VETS)
Indicators, Targets and Results
| *Indicator target reached (Y), improved (I), or not reached (N)
**Estimated |
PY 2003
Goal Achieved |
PY 2004
Goal Achieved |
PY 2005
Goal Achieved |
PY 2006
Goal Not Achieved |
PY 2007
Goal Achieved |
Percent of Veteran participants employed in the first quarter after exit |
Target |
58% |
58% |
59% |
60% |
61% |
Result |
58% |
60% |
62% |
60% |
61%** |
* |
Y |
Y |
Y |
Y |
Y |
Percent of Veteran participants employed in the first quarter after exit still employed in the second and third quarters after exit |
Target |
72% |
80% |
81% |
81% |
80% |
Result |
79% |
81% |
81% |
79% |
81%** |
* |
Y |
Y |
Y |
N |
Y |
Cost |
— |
— |
$89 |
$91 |
$93 |
Percent of Disabled Veteran participants employed in the first quarter after exit |
Target |
— |
54% |
55% |
55% |
56% |
Result |
— |
56% |
57% |
55% |
57%** |
* |
— |
Y |
Y |
Y |
Y |
Percent of Disabled Veteran participants employed in the first quarter after exit still employed in the second and third quarters after exit |
Target |
— |
78% |
79% |
79% |
79% |
Result |
— |
79% |
80% |
78% |
80%** |
* |
— |
Y |
Y |
N |
Y |
Cost |
— |
— |
$89 |
$91 |
$95 |
Entered employment rate for homeless veterans participating in the HVRP |
Target |
54.5% |
60% |
61% |
68% |
65.5% |
Result |
61% |
65% |
68% |
65% |
— |
* |
Y |
Y |
Y |
N |
— |
Employment retention rate after six months for homeless veteran HVRP participants |
Target |
— |
baseline |
58 |
58.5% |
64.5% |
Result |
— |
58% |
67% |
64% |
— |
* |
— |
Y |
Y |
Y |
— |
Cost |
— |
— |
$30 |
$30 |
$31 |
Goal Net Cost (millions) |
— |
$209 |
$212 |
$211 |
$221 |
Source(s): State Workforce Agency administrative reports, State unemployment insurance (UI) wage records and homeless veteran grantee reports.
Legacy Data: Some indicators not shown for FY 2003-06. Complete indicators, targets and results for FY 2003-06 are available in the FY 2006 report at /_sec/media/reports/annual2006/PGD.htm. See Performance Goal 05-1.1C.
Note: Costs for this goal are net costs as defined in a footnote to the Cost of Results discussion in Management's Discussion and Analysis. Costs are not allocated to the indicator level for employment and retention measures because program activities are not separable into categories associated with one or another of them. However, this goal includes two programs with three distinct target populations. Costs for each group (all veterans, disabled and homeless veterans) are provided in the cost cell opposite the retention indicators, where available. HVRP data for PY 2007 are not available because the reporting system was shut down for a mandatory system redesign.
Program Perspective and Logic
Jobs for Veterans State grants support the delivery of employment services needed by veterans and transitioning service members to promote their success in the civilian workforce. These grants support over 2,100 disabled veterans' outreach specialists and local veterans' employment representatives stationed at the nationwide network of nearly 3,000 comprehensive and affiliate One-Stop Career Centers. These staff serve as experts on workforce resources available for veterans. The local representatives emphasize the provision of services for recently separated veterans and handle outreach to employers, while the outreach specialists focus their efforts on intensive services for disabled veterans and other veterans with significant barriers to employment. The Homeless Veterans' Reintegration Program (HVRP) is a much smaller competitive grant program emphasizing stable employment as the critical factor in mitigating homelessness among veterans. Program participants are served by community-based grantees that provide pre-employment services, establish linkages with service providers funded by other Federal agencies, and rely on the specialists to assist them in finding employment once they are job-ready.
One-Stop Career Centers serve younger, recently separated veterans who have limited civilian work experience and older veterans with civilian experience who have become unemployed. HVRP grantees serve homeless veterans who have minimal attachment to the workforce. DOL applies the Federal job training program common measure definitions of entry to employment and retention in employment as the critical indicators of successful outcomes for all veterans and all disabled veterans who receive One-Stop services. During PY 2007, VETS issued guidance adding the average earnings indicator for all veterans and all disabled veterans who receive One-Stop services, and HVRP completed the transition to common measure definitions of its outcome measures. In setting performance targets, VETS seeks to improve service to veterans at a rate that is ambitious yet attainable.
Analysis and Future Plans
Results for HVRP were not available in time for inclusion in this report; they will be included in future reports. Therefore, achievement of this goal for PY 2007 is based on the four indicators for One-Stop services. Based on those results, this goal was achieved, as the targets were reached for all four indicators. The entered employment rate for all veterans equals the target, while the results for the other three indicators exceed the targets by one percentage point. Results in the charts below are for the first two indicators, which include disabled veterans.
The positive results for these indicators appear to be attributable primarily to measurement effects. In fact, the rebound of approximately two percentage points in the results for these indicators for the current year is nearly identical to the slump of approximately two percentage points experienced for these same indicators the prior year. This is believed to reflect the disruption in interstate sharing of data on employment outcomes during PY 2006 that was resolved during PY 2007.
The anticipated publication during PY 2008 of final regulations on priority of service for veterans is likely to enhance the delivery of veterans' employment services, leading to an improvement in employment outcomes for all veterans. In addition, to improve the outcomes of disabled veterans, VETS continues to expand the Recovery and Employment Assistance Lifelines program by assigning program outreach staff at major medical installations throughout the country. This program, which is complemented by efforts of the Departments of Defense and Veterans Affairs, provides individualized job training, counseling and re-employment services to seriously injured or wounded veterans of Operation Iraqi Freedom, Operation Enduring Freedom and other recent conflicts. Finally, VETS and the Department of Defense will be implementing a joint initiative during PY 2008 to increase the rate of participation by transitioning service members in Transition Assistance Program (TAP) employment workshops. That initiative is expected to result in an increase the number of veterans accessing One-Stop Career Centers and experiencing positive employment outcomes.
Net costs for this performance goal rose by ten percent from PY 2004-07 due to increased appropriations. The trend is uneven due to grantees' flexibility in the timing of expenditures.
PART, Program Evaluations and Audits
PART Year |
Rating |
PART Findings and Improvement Plan:
http://www.whitehouse.gov/omb/expectmore/
summary/10003907.2005.html |
2005
(State Grants) |
Moderately Effective |
FY 2008 Progress on PART Improvement Plan |
- Setting aggressive targets for performance outcomes to improve services to veterans. Guidance issued during 2008 called for negotiation of aggressive targets on the basis of consolidated outcomes across the two veterans' employment specialties, including the negotiation of weighted entry to employment targets for all veterans.
- Implementing recommendations from follow-up evaluation to assess veteran outcomes. The contractor responsible for this project has recruited a sample of States to participate in a follow-up study of those veterans whose measured outcomes were not successful. The final report is expected in PY 2008.
- Adding the Average Earnings measure to performance measures for All Veterans and for Disabled Veterans. Guidance issued during 2008 called for the negotiation of Average Earnings targets for All Veterans and for Disabled Veterans.
|
PART Year |
Rating |
PART Findings and Improvement Plan:
http://www.whitehouse.gov/omb/expectmore/
summary/10003912.2006.html |
2006
(HVRP) |
Moderately Effective |
FY 2008 Progress on PART Improvement Plan |
- Conducting a rigorous evaluation, to begin in 2007. Phase I of an independent evaluation to assess the impact of the Jobs for Veterans Act and the Workforce Investment Act on veterans' employment services and outcomes was completed last August. Phase II, which will analyze causal factors and recommend service improvements based on participant surveys, will be completed in PY 2008.
- Continuing to improve cost effectiveness and reducing cost disparities across grantees through a competitive grantee selection process and monitoring. During PY 2007, HVRP continued to re-compete all grants every three years; reserve a number of awards for grantees without prior HVRP experience; include cost-effectiveness as a criterion for grant award; and monitor grantees annually with respect to their actual costs per placement.
- Strengthening accountability by instituting common performance measures that will allow comparison between various job training programs. Measures will track employment, retention and earnings. During PY 2007, HVRP continued its intensive effort to build capacity in common measures across the network of grantees by conducting workshops for all participants at the program's annual conference, and planning field follow-up efforts.
|
Data Quality and Top Management Challenges
Data for this performance goal, rated Good by the Department's criteria,28 are tracked using two systems, one external to VETS. The four indicators addressing the outcomes of veterans and disabled veterans served by One-Stop Career Centers rely upon the reporting system for One-Stop Career Centers (Performance Goal 07-2C). Therefore, in general, the data quality assessment for that goal (Very Good) also applies to these indicators. The two indicators addressing outcomes for homeless veterans served by HVRP rely on the Veterans' Employment and Training Operations and Program Activity Report (VOPAR). VOPAR was out of service for most of PY 2007 pending redesign of the system that is expected to be completed in PY 2008. This affects the completeness criterion in the DOL data quality rating system, which in combination with the verifiability criterion not met for the other four indicators leads to a Good overall assessment for this goal's data. VETS issued revised guidance during PY 2007 that updated and improved several aspects of the agency's performance measurement systems. In addition, intensive workshops on common measures were conducted at the annual conference attended by all grantees' representatives, with further field follow-up planned. VETS has no DOL top management challenges.
21The three measures, also referred to as placement, credential attainment and literacy/numeracy, are: Percent of participants entering employment or enrolling in post-secondary education or advanced training/occupational skills training in the first quarter after exit; Percent of students who attain a GED, high school diploma or certificate by the end of the third quarter after exit; and Percent of students who will achieve literacy or numeracy gains of one Adult Basic Education (ABE) level (approximately equivalent to two grade levels).
22Rows labeled "Dollars not associated with indicators" indicate costs that cannot be associated with the current set of performance indicators. For some goals, indicator costs are intentionally combined by merging cells because program activities are not separable into categories associated with one or another of them (e.g., job training program common measures — entered employment, employment retention and average earnings).
23Net cost as defined in a footnote to the Cost of Results discussion in Management's Discussion and Analysis.
24Information on DOL's Data Quality Assessments, conducted annually for each performance goal, can be found in the Introduction to the Performance Section.
25Information on DOL's Data Quality Assessments, conducted annually for each performance goal, can be found in the Introduction to the Performance Section.
26Information on DOL's Data Quality Assessments, conducted annually for each performance goal, can be found in the Introduction to the Performance Section.
27Information on DOL's Data Quality Assessments, conducted annually for each performance goal, can be found in the Introduction to the Performance Section.
28Information on DOL's Data Quality Assessments, conducted annually for each performance goal, can be found in the Introduction to the Performance Section.
 |
|
 |
|