


Chirp systems
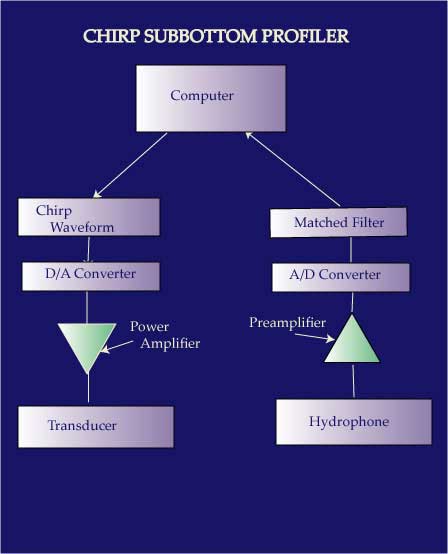
Chirp systems emit a 'swept'-frequency signal, meaning that the transmitted signal is emitted over a period of time and over a set range of frequencies. This repeatable (transmitted) waveform can be varied in terms of pulse length, frequency bandwidth, and phase/amplitude. A matched filter, or correlation process, collapses the swept frequency modulated (FM) received signal into a pulse of short duration, maximizing the signal-to-noise-ratio (after Mosher and Simpkin, 1999). On some of the WHSC systems, tow vehicle depth, tow vehicle altitude, and vehicle pitch, roll and heading are digitally recorded during data acquisition, so that appropriate corrections can be made during data processing. The reflected signal is received by the same tuned transducer array that generates the outgoing acoustic energy.
Chirp systems enable high-resolution mapping of relatively shallow deposits, and in general, have less penetration than the impulse-type systems (air or water guns, sparker, and boomer).Newer chirp systems are able to penetrate to comparable levels as the boomer, yet yield extraordinary detail or resolution of the section.Penetration depths range from about 3 m. in coarse sand to about 200 m. in finer-grained sediments, depending on the frequency range of the outgoing signal and the system employed. Resolution varies from about 4 to 40 cm, depending on the frequency range of the system used and the sediment type.
The WHSC operates four chirp systems ranging in physical size and frequencies, thus providing us with the flexibility to work in a variety of marine environments. Operating frequency ranges are 500 Hz to 12 kHz, 2 to 7 kHz, 4 to 24 kHz, and 3.5 and 200 kHz (fathometer). We operate the 3.5/200 kHz fathometer continuously throughout all operations interfacing it with the DGPS (navigation) receiver in order to acquire 'trackline bathymetry' or depth values directly below the ship trackline.
 |
 |
 |
| Onboard, ready for deployment. | Benthos SIS-1000 on Deck. | Deployment of the SIS-1000 |
|---|
 |
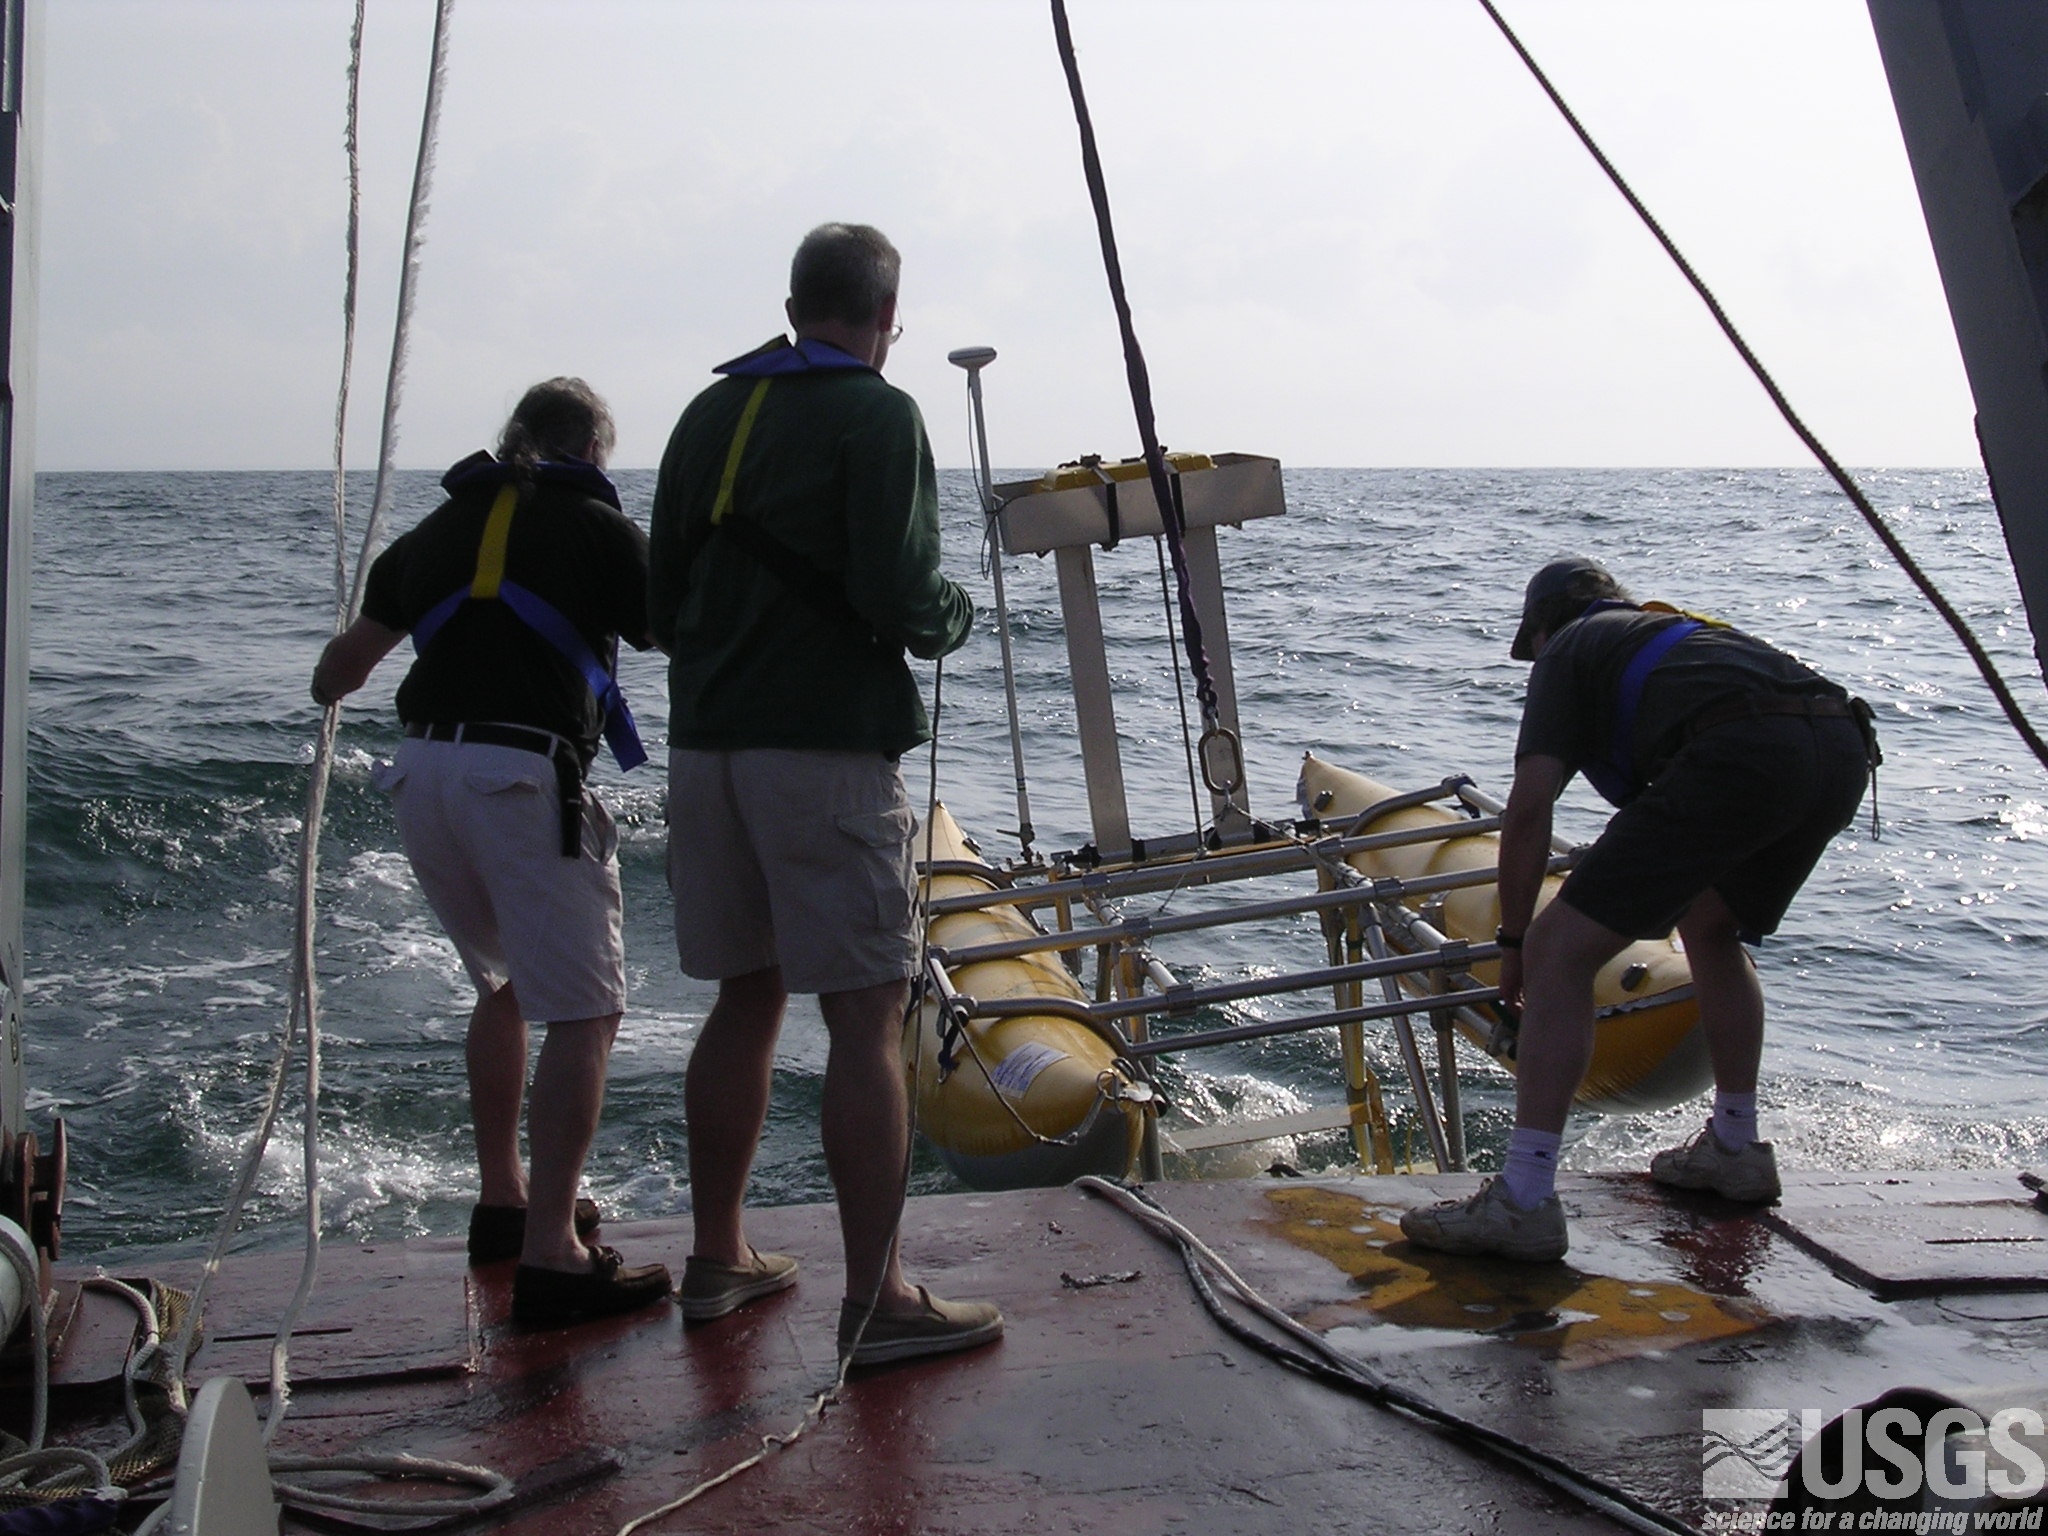 |
| Deployment of chirp system from the fantail of the R/V Atlantic Surveyor. Chirp and flotation rigging are lifted and briefly suspended above the deck for final check-over prior to moving the system over the water and lowering it to the sea surface. | Deployment of chirp system from the R/V Atlantic Surveyor. Once the system is moved free of the fantail of the ship, it is lowered to the sea surface. Operators carefully guide it into the water, avoiding contact with the ship. |
|---|
System Operation
With the exception of the fathometer, our chirp systems are towed astern.
 |
 |
| Deeper water tow | Shallow water tow, nearshore South Carolina |
|---|
System Usage
WHSC has used Chirp systems in the open ocean, coastal areas, lakes, and estuarine areas and over a wide spectrum of bottom types. Most of our current investigations are using CHIRP systems rather than the other seismic systems due to the flexibility the chirp system has to offer. By choosing the appropriate frequency range, we can "tune" the chirp system for the best results in varying bottom sediment types. For example, we may choose to utilize the 2-7 kHz spectrum on our 0.5-12 kHz system in sandy areas to achieve better penetration of the signal, or select higher frequency ranges in softer sediments for improved resolution.
 |
| Example of bathymetric data collected during a USGS research cruise aboard the R/V Gyre using the 3.5 kHz system in the Keathley Canyon. Horizontal tic marks are 2-minute time markers. Vertical scale is two-way travel time with tic lines shown every 10 ms. Data are highly vertically exaggerated: horizontal distance shown is about 5 km; vertical distance shown is about 75 m. Vertical noise bursts randomly across the record are interference from the GI gun shots. (USGS OF 03-474). |
|---|
 |
| Chirp profile from Bear Lake, Idaho-Utah acquired from the R/V Rafael. Bear Lake is a half-graben with a fault-defined eastern boundary. Note detail of sedimentary layers evident, even when interlayered with highly reflective surfaces. Vertical scale is two-way travel time in seconds. Water depth mid-basin on this profile is approximately 45 m., assuming a water velocity of 1500 m/sec. USGS OF 03-150 |
 |
| Chirp sub-bottom profile offshore of Murrells Inlet, South Carolina collected in 2001, using the 5-12 kHz system. The seismic profile displays underlying Cretaceous/Tertiary strata gently dipping to the southeast (red), paleochannels associated with old river systems which incised the Cretaceous/Tertiary strata at sea-level low stands (orange), and the regional unconformity representing the latest marine transgression (blue). Also displayed is a shoal complex associated with Murrells Inlet. Vertical scale is displayed as two-way travel time in milliseconds and approximate depth in meters (assuming 1500 meters/second speed of sound). (Figure modified from Baldwin, 2002) |
 |
| Chirp profile showing well stratified glacial drift interpreted to be glaciolacustrine deposits (Qdl). The unit has an apparent landward dip. The deformation of the stratified unit to the east may indicate it was deposited in close proximity to the South Channel lobe. The light green horizon is interpreted to be the base of the glaciolacustrine. The dark green horizon is the top of the unit where there is a facies change to non-stratified glacial drift (Qd). The yellow horizon is the Holocene transgressive unconformity. This surface truncates Qdl to the east. USGS OF 03-235 |
References
Baldwin, W.E., 2002, Effects of local and regional antecedant geology on the modern inner continental shelf: southern Long Bay, South Carolina: Unpublished ms Thesis, Department of Geological Sciences, University of South Carolina, Columbia, S.C., 138 p.Denny, J.F., and Colman, S.M., 2003, Geophysical surveys of Bear Lake, Utah-Idaho, September 2002, U.S. Geological Survey Open-File Report 03-150, CD-ROM.
Foster, D.S., and Poppe, L.J., 2003, High-resolution seismic-reflection surveys in the nearshore of lower Cape Cod, Massachusetts, U.S. Geological Survey Open-File Report 03-235, Web Only,
Hutchinson, D.R., and Hart, P.E., 2004, Cruise report for G1-03-GM, USGS gas hydrates cruise, R/V Gyre, 1-14 May, 2003, northern Gulf of Mexico, U.S. Geological Survey Open-File Report 03-474, 103 p.
Mosher, D.C. and P.G. Simpkin, 1999, Status and trends of marine high-resolution seismic profiling: data acquisition, Geoscience Canada, v. 26 (4), p. 6.
Schwab, W.C., Denny, J.F., Foster, D.S., Lotto, L.L., Allison, A.L., Uchupi, E., Swift, B.A., Danforth, W.W., Thieler, E.R., and Butman, B., 2003, High-resolution quaternary seismic stratigraphy of the New York Bight Continental Shelf, U.S. Geological Survey Open-File Report 02-152, DVD-ROM.

