|
Summary Table: Diagnosis
|
|
Only one measure per topic is displayed in the summary table. A complete set of measures, where they exist, can be found in the report.
| Trend key: |
 |
solid green - headed in the right direction |
| |
 |
dotted red - headed in the wrong direction |
| |
 |
dashed black - stable
or non-significant change (NSC) |
| |
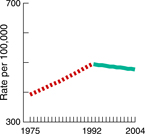
Incidence
1975-2004 |
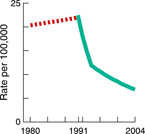
Stage at Diagnosis
1980-2004 |
| Measure |
The observed number of new cancer cases per 100,000 people per year, adjusted for cancer case reporting delays, based on data from approximately 10 percent of the U.S. population. |
The number of new cancer cases diagnosed at a late (distant) stage, per 100,000 people per year. (Example: prostate cancer). |
| Trend |
Rising, then falling
 |
Rising, then falling
 |
| Desired direction |
Falling  |
Falling |
| Most recent estimate |
In 2004, the rate of new cases of all cancers combined was 471.6 per 100,000 people per year. |
In 2004, 6.5 new cases of prostate cancer per 100,000 men were diagnosed at a late stage. |
| Healthy People 2010 target |
There is no Healthy People 2010 target for cancer incidence. |
There is no Healthy People 2010 target for stage at diagnosis. |
| More information |
|
|