|
Summary Tables by Topic |
|
How to Read the Summary Tables
The tables in this section summarize the measures that are described at greater length in the body of this report. A graph, which addresses two questions, is included for most measures:
- Is the trend moving in the desired direction?
- A graph shows the trend direction for the measure. The desired trend direction is shown below the graph.
- Each line in the graph is coded by color and line style to indicate whether the trend is:
 |
solid green - headed in the right direction |
 |
dotted red - headed in the wrong direction |
 |
dashed black - stable
or non-significant change (NSC) |
- How does the nation's progress compare to the Healthy People 2010 target?
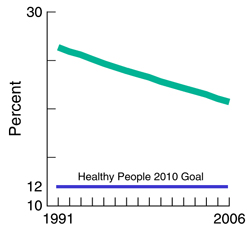
Not all measures have an associated Healthy People 2010 target. When there is a target for a specific measure, it is shown by a solid blue horizontal line labeled “Healthy People 2010 Goal”.
The example below demonstrates the Adult Smoking trend, which is heading in the right direction (solid green line) toward the Healthy People 2010 Goal (solid blue horizontal line).