 |
|
| National Information Center on Health Services Research and Health Care Technology (NICHSR) | |
HTA 101: IV. COST ANALYSIS METHODS
- Main Types of Cost Analysis
- Quandrants of Cost-Effectiveness
- Key Attributes of Cost Analyses
- Collecting Cost Data Alongside Clinical Studies
Studies of costs and related economic implications comprise a major group of methods used in HTA. These studies can involve attributes of either or both of primary data collection and integrative methods. That is, cost data can be collected as part of RCTs and other clinical studies, as well as administrative databases used in health care payment. Cost data from one or more such sources often are combined with data from primary clinical studies, epidemiological studies, and other sources to conduct cost-effectiveness analyses and other cost studies that involve weighing health and economic impacts of health technology.
Interest in cost analyses has accompanied concerns about rising health care costs, pressures on health care policymakers to allocate resources, and the need for health product makers and other technology advocates to demonstrate the economic benefits of their technologies. This interest is reflected in a considerable increase in the number of reports of cost analyses in the literature and further refinement of methods.
Main Types of Cost Analysis
There is a variety of approaches to cost analysis, the suitability of any of which depends upon the purpose of an assessment and the availability of data and other resources. It is rarely possible or necessary to identify and quantify all costs and all benefits (or outcomes), and the units used to quantify these may differ.
Main types of cost analysis include the following.
- Cost-of-illness analysis: a determination of the economic impact of an illness or condition (typically on a given population, region, or country) e.g., of smoking, arthritis or bedsores, including associated treatment costs
- Cost-minimization analysis: a determination of the least costly among alternative interventions that are assumed to produce equivalent outcomes
- Cost-effectiveness analysis (CEA): a comparison of costs in monetary units with outcomes in quantitative non-monetary units, e.g., reduced mortality or morbidity
- Cost-utility analysis (CUA): a form of cost-effectiveness analysis that compares costs in monetary units with outcomes in terms of their utility, usually to the patient, measured, e.g., in QALYs
- Cost-consequence analysis: a form of cost-effectiveness analysis that presents costs and outcomes in discrete categories, without aggregating or weighting them
- Cost-benefit analysis (CBA): compares costs and benefits, both of which are quantified in common monetary units.
Box 18 contrasts the valuation of costs and outcomes among these alternative economic analyses.
Different Types of Economic Analysis
|
|
Valuation of costs |
|
Valuation of outcomes |
|
Cost of Illness |
$ |
vs. |
None |
|
Cost Minimization |
$ |
vs. |
Assume same |
|
Cost Effectiveness |
$ |
÷ |
Natural units |
|
Cost Utility |
$ |
÷ |
Utiles (e.g., QALYs) |
|
Cost Benefit |
$ |
÷ or - |
$ |
Cost-minimization analysis, CEA and CUA necessarily involve comparisons of alternative interventions. A technology cannot be simply cost effective, though it may be cost effective compared to something else. Although CBA typically involves comparisons of alternative technologies, this is not necessary.
Because it measures costs and outcomes in monetary (not disease-specific) terms, CBA enables comparison of disparate technologies, e.g., coronary artery bypass graft surgery and screening for breast cancer. A drawback of CBA is the difficulty of assigning monetary values to all pertinent outcomes, including changes in the length or quality of human life. CEA avoids this limitation by using more direct or natural units of outcomes such as lives saved or strokes averted. As such, CEA can only compare technologies whose outcomes are measured in the same units. In CUA, estimates of utility are assigned to health outcomes, enabling comparisons of disparate technologies.
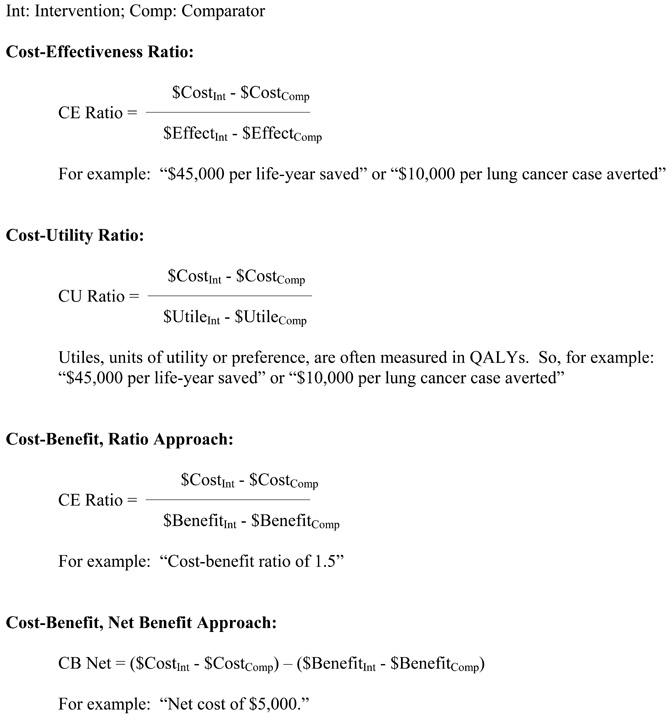
Two basic approaches for cost-benefit analysis (CBA) are ratio approach and the net benefit approach. The ratio approach indicates the amount of benefits (or outcomes) that can be realized per unit expenditure on a technology vs. a comparator. In the ratio approach, a technology is cost beneficial vs. a comparator if the ratio of the change in costs to the change in benefits is less than one. The net benefits approach indicates the absolute amount of money saved or lost due to a use of a technology vs. a comparator. In the net benefits formulation, a technology is cost-beneficial vs. a comparator if the net change in benefits exceeds the net change in costs. The choice between a net benefits approach or a benefit/cost approach for a CBA can affect findings. The approach selected may depend upon such factors as whether costs must be limited to a certain level, whether the intent is to maximize the absolute level of benefits, whether the intent is to minimize the cost/benefit ratio regardless of the absolute level of costs, etc. Indeed, under certain circumstances these two basic approaches may yield different preferences among alternative technologies.
Box 19 shows basic formulas for determining CEA, CUA, and CBA.
Basic Formulas for CEA, CUA, and CBA
Quadrants of Cost-Effectiveness
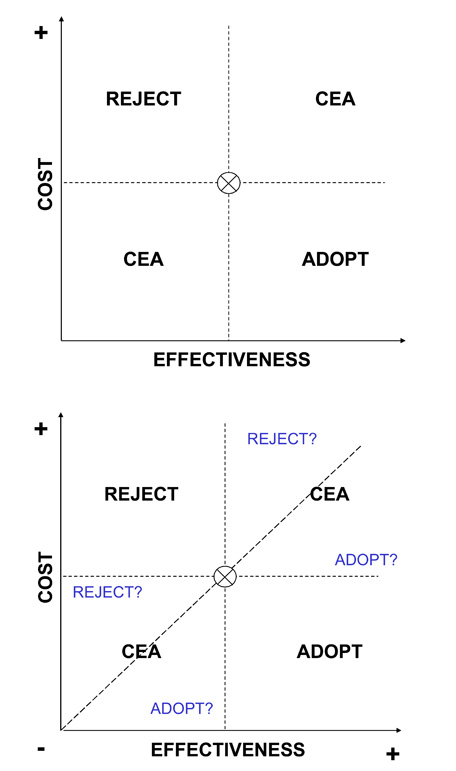
A basic approach to portraying a cost-effectiveness (or cost-utility) comparison of a new intervention to a standard of care is to consider the cost and effectiveness of a new intervention in the space of four fields as shown in Box 20, starting with the upper figure. The level of costs and the level of effectiveness for the standard of care are indicated by the "X" in the middle of the figure. A new intervention may have higher or lower costs, and higher or lower effectiveness, such that its plot may fall into one of the four quadrants surrounding the costs and effectiveness of the standard of care. If it is known that the plot of the new intervention falls into either of two of the quadrants, i.e., where the new intervention has higher costs and lower effectiveness (indicating that it should be rejected), or it has lower costs and higher effectiveness (indicating that it should be adopted), then no further analysis may be required. If it is known that the plot of the new intervention falls into either of the other two quadrants, i.e., where the new intervention has higher costs and higher effectiveness, or it has lower costs and lower effectiveness, then further analysis weighing the marginal costs and effectiveness of the new intervention compared to the standard of care may be required.
Within either of the two quadrants that entail weighing tradeoffs of costs and effectiveness, it may be apparent that the marginal tradeoff of costs and outcomes is so high or low as to suggest rejection or adoption. As shown in the lower figure of Box 20, this arises when the new intervention yields only very low marginal gain in effectiveness at a very high marginal cost (reject), or yields very high marginal improvements in effectiveness at a very low marginal cost (adopt).
Key Attributes of Cost Analyses
The approaches to accounting for costs and outcomes in cost analyses can vary in a number of important respects, some of which are addressed briefly below. These should be carefully considered by assessors, as well as the policymakers who intend to make use of assessment findings. Given the different ways in which costs and outcomes may be determined, all studies should make clear their methodology in these respects (Byford 1998; Drummond 1997; Gold 1996).
Comparator. Any cost analysis of one intervention versus another must be specific about the comparator. This may be standard of care (current best practice), minimum practice, or no intervention. Some analyses that declare the superiority of a new intervention may have used a comparator that is no longer in practice or is considered sub-standard care or that is not appropriate for the patient population of interest.
Perspective. The perspective of a cost analysis refers to the standpoint at which costs and outcomes (or consequences or benefits) are realized. For instance, the perspective of an analysis may be that of society overall, a third-party payer, a physician, a hospital, or a patient. Clearly, costs and outcomes are not realized in the same way from each of these perspectives. Many analysts favor using the broad perspective of society and identifying all costs and all outcomes accordingly. However, "society" as such may not be the decisionmaker, and what is cost effective from that perspective may not be what is cost effective from the standpoint of a ministry of health, third-party payer, hospital manager, patient, or other decisionmaker. It is possible that this perspective may resemble that of a national or regional government, if indeed that government experiences (or is responsible for representing the perspectives of those that experience) all of the costs and outcomes that are included in a societal perspective.
Quadrants of Cost-Effectiveness
Direct Costs. Depending upon the perspective taken, cost analyses should identify two types of direct costs. Direct costs represent the value of all goods, services, and other resources consumed in providing health care or dealing with side effects or other current and future consequences of health care. Two types of direct costs are direct health care costs and direct non-health care costs.
Direct health care costs include costs of physician services, hospital services, drugs, etc. involved in delivery of health care. Direct non-health care costs are incurred in connection with health care, such as for care provided by family members and transportation to and from the site of care. In quantifying direct health care costs, many analyses use readily available hospital or physician charges (i.e., price lists) rather than true costs, whose determination may require special analyses of resource consumption. However, charges (as well as actual payments) tend to reflect provider cost shifting and other factors that decrease the validity of using charges to represent the true costs of providing care.
Indirect Costs. Analyses should account for indirect costs, sometimes known as "productivity losses." These include the costs of lost work due to absenteeism or early retirement, impaired productivity at work, and lost or impaired leisure activity. Indirect costs also include the costs of premature mortality. Intangible costs of pain, suffering, and grief are real, yet very difficult to measure and are often omitted from cost analyses.
Time Horizon. Interpretation of cost analyses must consider that the time horizon (or time-frame) of a study is likely to affect the findings regarding the relative magnitudes of costs and outcomes of a health care intervention. Costs and outcomes usually do not accrue in steady streams over time. Comparisons of costs and outcomes after one year may yield much different findings than comparisons made after 5, 10, or 25 years. The meaningful time horizons for assessing the cost horizons of each of emergency appendectomies, cholesterol-lowering in high-risk adults, and smoking cessation in teenagers are likely to be quite different. For example, an analysis conducted for the Medicare program in the US to determine cost and time tradeoffs of hemodialysis and kidney transplantation showed that the annualized expenditure by the Medicare End-Stage Renal Disease Program for a dialysis patient was $32,000. Although patients with functioning transplanted kidneys required a first-year expenditure of $56,000, they cost Medicare only an average of $6,400 in succeeding years. On average, estimated cumulative dialysis and transplantation costs reach a break-even point in about three years, after which transplantation provides a net financial gain compared to dialysis (Rettig 1991).
Time horizons should be long enough to capture streams of health and economic outcomes (including significant intended and unintended ones). These could encompass a disease episode, patient life, or even multiple generations of life (such as for interventions in women of child-bearing age or interventions that may cause heritable genetic changes). Quantitative modeling approaches may be needed to estimate costs and outcomes that are beyond those of available data. Of course, the higher the discount rate used in an analysis, the less important are future outcomes and costs.
Average Costs vs. Marginal Costs. Assessments should make clear whether average costs or marginal costs are being used in the analysis. Whereas average cost analysis considers the total (or absolute) costs and outcomes of an intervention, marginal cost analysis considers how outcomes change with changes in costs (e.g., relative to a comparator), which may provide more information about how to use resources efficiently. Marginal cost analysis may reveal that, beyond a certain level of spending, the
additional benefits are no longer worth the additional costs. For example, as shown in Box 21, the average cost per desired outcome of an iterative screening test may appear to be quite acceptable (e.g.,$2,451 per case of colorectal cancer detected assuming a total of six tests per person), whereas marginal cost analysis demonstrates that the cost of adding the last test (i.e., the additional cost of the sixth test per person) to detect another case of cancer would be astronomical.
Average Cost Analysis vs. Marginal Cost Analysis
The importance of determining marginal costs is apparent in the analysis by Neuhauser and Lewicki of a proposed protocol of sequential stool guaiac testing for colon cancer. Here, average cost figures obscure a steep rise in marginal costs of testing because the high detection rate from the initial tests is averaged over subsequent tests that contribute little to the detection rate. This type of analysis helps to demonstrate how it is possible to spend steeply increasing health care resources for diminishing returns in health benefits.
Cancer screening and detection costs with sequential guaiac tests
|
No. |
No. of cancers |
Additional |
Total cost ($) of diagnosis |
Additional |
Average cost ($) |
Marginal cost ($) |
|
1 |
65.9469 | 65.9469 | 77,511 | 77,511 | 1,175 | 1,175 |
| 2 | 71.4424 | 5.4956 | 107,690 | 30,179 | 1,507 | 5,492 |
| 3 | 71.9004 | 0.4580 | 130,199 | 22,509 | 1,810 | 49,150 |
| 4 | 71.9385 | 0.0382 | 148,116 | 17,917 | 2,059 | 469,534 |
| 5 | 71.9417 | 0.0032 | 163,141 | 15,024 | 2,268 | 4,724,695 |
| 6 | 71.9420 | 0.0003 | 176,331 | 13,190 | 2,451 | 47,107,214 |
This analysis assumed that there were 72 true cancer cases per 10,000 population. The testing protocol provided six stool guaiac tests per person to detect colon cancer. If any one of the six tests was positive, a barium-enema test was performed, which was assumed to yield no falsepositive and no false-negative results. Other assumptions: the true-positive cancer detection rate of any single guaiac test was 91.667%; the false-positive rate of any single guaiac test was 36.508%; the cost of the first stool guaiac test was $4 and each subsequent guaiac test was $1; the cost of a barium-enema was $100. The marginal cost per case detected depends on the population screened and the sensitivity of the test used.
Source: Neuhauser 1975.
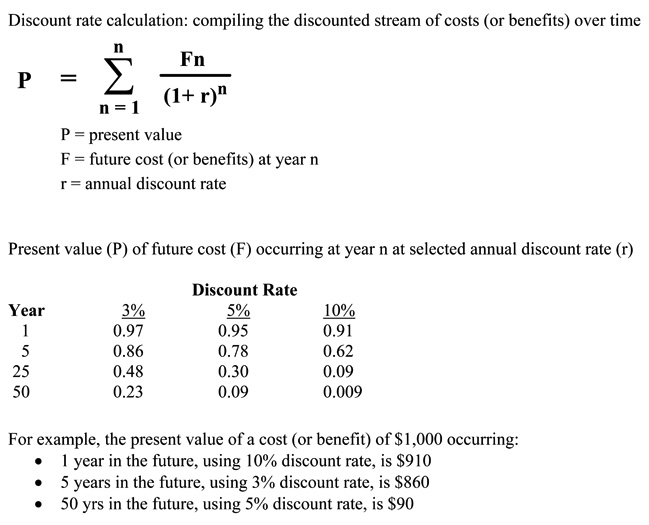
Discounting. Cost analyses should account for the effect of the passage of time on the value of costs and outcomes. Costs and outcomes that occur in the future usually have less present value than costs and outcomes realized today. Discounting reflects the time preference for benefits earlier rather than later; it also reflects the opportunity costs of capital, i.e., whatever returns on investment that could have been gained if resources had been invested elsewhere. Thus, costs and outcomes should be discounted relative to their present value (e.g., at a rate of five percent per year).
Discounting allows comparisons involving costs and benefits that flow differently over time. It is less relevant for "pay as you go" benefits, such as if all costs and benefits are realized together within one year. It is more relevant in instances where these do not occur in parallel, such as when most costs are realized early and most benefits are realized in later years. Discount rates used in cost analyses are typically based on interest rates of government bonds or the market interest rates for the cost of capital whose maturity is about the same as the duration of the effective time horizon of the health care intervention of program being evaluated. Box 22 shows the basic formula for calculating present values for a given discount rate, as well as how the present value of a cost or benefit that is discounted at selected rates is affected over time.
Cost analyses should also correct for the effects of inflation (which is different from the time preference accounted for by discounting), such as when costs or cost-effectiveness for one year are compared to another year.
Sensitivity Analysis. Any estimate of costs, outcomes, and other variables used in a cost analysis is subject to some uncertainty. Therefore, sensitivity analysis should be performed to determine if plausible variations in the estimates of certain variables thought to be subject to significant uncertainty affect the results of the cost analysis. A sensitivity analysis may reveal, for example, that including indirect costs, or assuming the use of generic as opposed to brand name drugs in a medical therapy, or using a plausible higher discount rate in an analysis changes the cost-effectiveness of one intervention compared to another.
Collecting Cost Data Alongside Clinical Studies
The validity of a cost-related study depends upon the sources of the data for costs and outcomes. Increased attention is being given to collection of cost data in more rigorous, prospective studies, particularly RCTs. The closer integration of economic and clinical studies raises important methodological issues. In order to promote more rational diffusion of new technologies, it would be desirable to generate reliable cost and outcomes data during the early part of a technology's lifecycle, such as during RCTs required prior to marketing approval. An RCT would be expected to yield the most reliable data concerning efficacy of an intervention; however, the care given in an RCT and the costs of providing it may be atypical compared to more general settings. For example, RCTs may involve more extensive and frequent laboratory tests and other patient monitoring, and may occur more often in academic medical centers whose costs tend to be higher than in community health care institutions. Other aspects of trial design, sample size, choice of outcome measures, identification and tabulation of costs, burden on investigators of data collection and related matters affect the usefulness of clinical trial data for meaningful economic studies (Briggs 2003; Drummond 1991; Graves 2002; Poe 1995). Also, the growth of multinational clinical trials of drugs and other technologies raises challenges of estimating country-specific treatment effects and cost-effectiveness, given differences in epidemiological factors, health care delivery models, resource use, and other factors (Willke 1998).
Discount Rate Calculation and Use in Determining Present Value of Future Costs and Benefits
In practice, there is wide variation in economic study methodologies (Elixhauser 1998; Nixon 2000). Although some variation is unavoidable, many differences in perspective, accounting for direct and indirect costs, time frames, discounting and other aspects are often arbitrary, result from lack of expertise, and may reflect biases on the part of investigators or sponsors. This diminishes comparability and transferability of study results as well as credibility of findings. National and international groups have developed and revised voluntary standards for conducting and reporting economic studies of health care technologies (Drummond 1996; Glennie 1999; Gold 1996; Taylor 2002). A recent review of 25 guidelines from North America, Europe, and Australia found a general trend toward harmonization in most methodological aspects, although there were more differences in such dimensions as choice of economic perspective, resources, and costs to be included in analysis (Hjelmgren 2001).
Previous Section Next Section Table of Contents NICHSR Home Page
Last reviewed: 08 September 2008
Last updated: 08 September 2008
First published: 19 August 2004
Metadata| Permanence level: Permanent: Stable Content