Statistics
The facts and figures in this section display the impact of cancer health disparities. For more information, please visit our Examples of Health Disparities page and our Data Sources and Tools page. Also, check out the following websites:
Cancer Incidence and Mortality Rates
Following is a brief overview of the historic and currently available data on cancer health disparities among racial and ethnic groups for select cancers (breast, cervical, colorectal, liver, lung, prostate, and stomach). The rates are based on SEER incidence data and NCHS mortality data. For more information, please visit SEER, NCHS, and State Cancer Profiles.
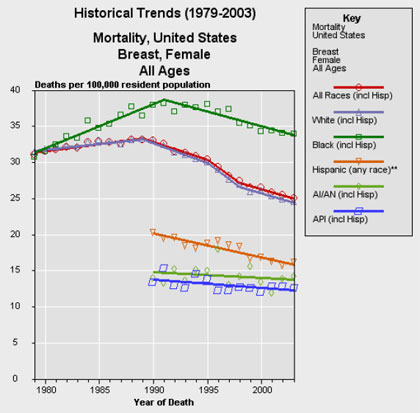
Breast Cancer
U.S. Breast Cancer Incidence and Mortality Data 2000-2003
Based on SEER incidence data and NCHS mortality data
| |
Incidence rate
(per 100,000 women) |
Mortality rate
(per 100,000 women) |
| All Races |
129.1 |
25.8 |
| White |
134 |
25.3 |
| Black |
118 |
34.3 |
| Asian/Pacific Islander |
88.6 |
12.6 |
American Indian/
Alaskan Native |
74.4 |
13.4 |
| Hispanic |
89.1 |
16.2 |
| Source: Ries LAG, Harkins D, Krapcho M, Mariotto A, Miller BA, Feuer EJ, Clegg L, Eisner MP, Horner MJ, Howlader N, Hayat M, Hankey BF, Edwards BK (eds). SEER Cancer Statistics Review, 1975-2003, National Cancer Institute. Bethesda, MD, http://seer.cancer.gov/csr/1975_2003/, based on November 2005 SEER data submission, posted to the SEER web site 2006. |
|
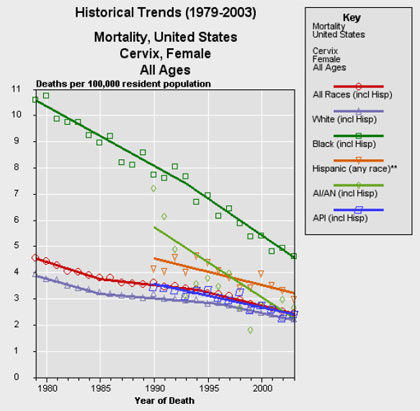
Cervical Cancer
U.S. Cervical Cancer Incidence and Mortality Data 2000-2003
Based on SEER incidence data and NCHS mortality data
| |
Incidence rate
(per 100,000 women) |
Mortality rate
(per 100,000 women) |
| All Races |
8.8 |
2.6 |
| White |
8.5 |
2.4 |
| Black |
11.5 |
5 |
| Asian/Pacific Islander |
8.2 |
2.5 |
American Indian/
Alaskan Native |
7.2 |
2.8 |
| Hispanic |
14.2 |
3.4 |
| Source: Ries LAG, Harkins D, Krapcho M, Mariotto A, Miller BA, Feuer EJ, Clegg L, Eisner MP, Horner MJ, Howlader N, Hayat M, Hankey BF, Edwards BK (eds). SEER Cancer Statistics Review, 1975-2003, National Cancer Institute. Bethesda, MD, http://seer.cancer.gov/csr/1975_2003/, based on November 2005 SEER data submission, posted to the SEER web site 2006. |
|
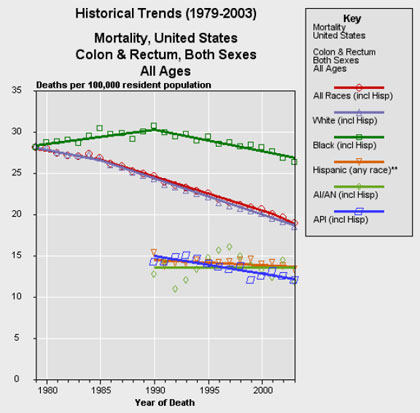
Colorectal Cancer
U.S. Colorectal Cancer Incidence and Mortality Data 2000-2003
Based on SEER incidence data and NCHS mortality data
| |
Men |
Women |
| |
Incidence rate
(per 100,000) |
Mortality rate
(per 100,000)
|
Incidence rate
(per 100,000) |
Mortality rate
(per 100,000) |
| All Races |
61.7 |
24 |
45.3 |
16.8 |
| White |
61.4 |
23.4 |
44.7 |
16.2 |
| Black |
72.9 |
33.4 |
56.1 |
23.4 |
| Asian/Pacific Islander |
51.2 |
15.4 |
35s.7 |
10.5 |
American Indian/
Alaskan Native | 52.7 |
15.6 |
41.9 |
11 |
|---|
| Hispanic |
47.3 |
17.3 |
32.7 |
11.3 |
| Source: Ries LAG, Harkins D, Krapcho M, Mariotto A, Miller BA, Feuer EJ, Clegg L, Eisner MP, Horner MJ, Howlader N, Hayat M, Hankey BF, Edwards BK (eds). SEER Cancer Statistics Review, 1975-2003, National Cancer Institute. Bethesda, MD, http://seer.cancer.gov/csr/1975_2003/, based on November 2005 SEER data submission, posted to the SEER web site 2006. |
|
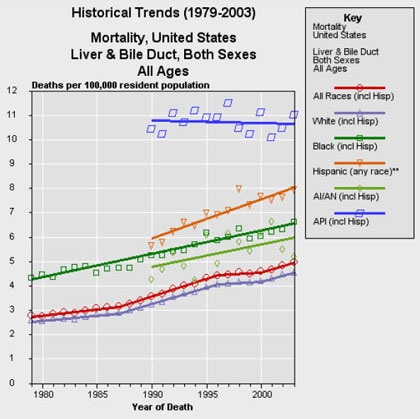
Liver Cancer
U.S. Liver and Intrahepatic Bile Duct Cancer Incidence and Mortality Data 2000-2003
Based on SEER incidence data and NCHS mortality data
| |
Men |
Women |
| |
Incidence rate
(per 100,000) |
Mortality rate
(per 100,000) |
Incidence rate
(per 100,000) |
Mortality rate
(per 100,000) |
| All Races |
9.3 |
7.1 |
3.3 |
3 |
| White |
7.8 |
6.4 |
2.8 |
2.8 |
| Black |
12.1 |
9.8 |
3.5 |
3.8 |
| Asian/Pacific Islander |
20.9 |
15.6 |
8 |
6.8 |
American Indian/
Alaskan Native |
14.5 |
8.1 |
6.5 |
3.9 |
| Hispanic |
14.1 |
10.7 |
5.6 |
5 |
| Source: Ries LAG, Harkins D, Krapcho M, Mariotto A, Miller BA, Feuer EJ, Clegg L, Eisner MP, Horner MJ, Howlader N, Hayat M, Hankey BF, Edwards BK (eds). SEER Cancer Statistics Review, 1975-2003, National Cancer Institute. Bethesda, MD, http://seer.cancer.gov/csr/1975_2003/, based on November 2005 SEER data submission, posted to the SEER web site 2006. |
|
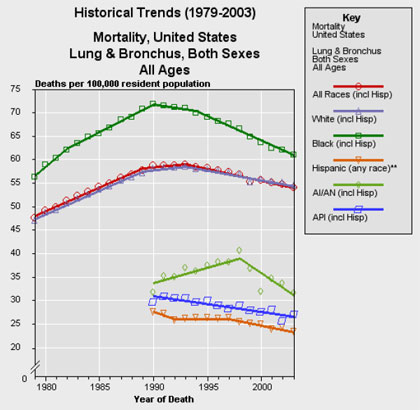
Lung Cancer
U.S. Lung & Bronchus Cancer Incidence and Mortality Data 2000-2003
Based on SEER incidence data and NCHS mortality data
| |
Men |
Women |
| |
Incidence rate
(per 100,000) |
Mortality rate
(per 100,000) |
Incidence rate
(per 100,000) |
Mortality rate
(per 100,000) |
| All Races |
82.1 |
74.2 |
52.3 |
41.2 |
| White |
81.7 |
73.4 |
54.7 |
42.2 |
| Black |
112.2 |
97.2 |
53.1 |
39.8 |
| Asian/Pacific Islander |
55.7 |
38.6 |
27.3 |
18.6 |
American Indian/
Alaskan Native |
55.5 |
41.4 |
33.8 |
26.8 |
| Hispanic |
44.7 |
36.6 |
24 |
14.7 |
| Source: Ries LAG, Harkins D, Krapcho M, Mariotto A, Miller BA, Feuer EJ, Clegg L, Eisner MP, Horner MJ, Howlader N, Hayat M, Hankey BF, Edwards BK (eds). SEER Cancer Statistics Review, 1975-2003, National Cancer Institute. Bethesda, MD, http://seer.cancer.gov/csr/1975_2003/, based on November 2005 SEER data submission, posted to the SEER web site 2006. |
|
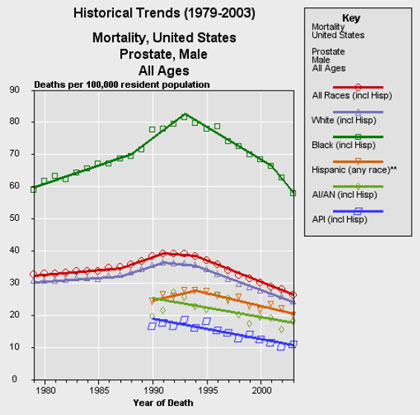
Prostate Cancer
U.S. Prostate Cancer Incidence and Mortality Data 2000-2003
Based on SEER incidence data and NCHS mortality data
| |
Incidence rate
(per 100,000 men) |
Mortality rate
(per 100,000 men) |
| All Races |
170.3 |
28.5 |
| White |
163.4 |
26.2 |
| Black |
258.3 |
64 |
| Asian/Pacific Islander |
96.8 |
11.3 |
American Indian/
Alaskan Native |
70.7 |
18.1 |
| Hispanic |
141.1 |
21.8 |
| Source: Ries LAG, Harkins D, Krapcho M, Mariotto A, Miller BA, Feuer EJ, Clegg L, Eisner MP, Horner MJ, Howlader N, Hayat M, Hankey BF, Edwards BK (eds). SEER Cancer Statistics Review, 1975-2003, National Cancer Institute. Bethesda, MD, http://seer.cancer.gov/csr/1975_2003/, based on November 2005 SEER data submission, posted to the SEER web site 2006. |
|
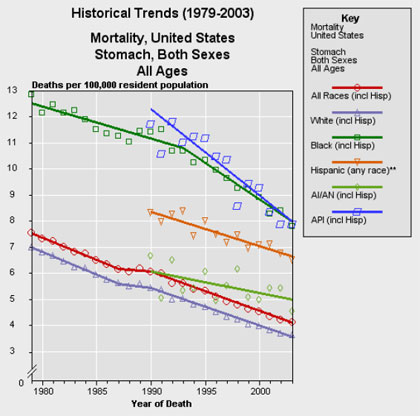
Stomach Cancer
U.S. Stomach Incidence and Mortality Data 2000-2003
Based on SEER incidence data and NCHS mortality data
| |
Men |
Women |
| |
Incidence rate
(per 100,000) |
Mortality rate
(per 100,000) |
Incidence rate
(per 100,000) |
Mortality rate
(per 100,000) |
| All Races |
11.5 |
6 |
5.6 |
3.1 |
| White |
10.2 |
5.3 |
4.7 |
2.7 |
| Black |
17.7 |
12.1 |
9.3 |
6 |
| Asian/Pacific Islander |
18.9 |
10.8 |
11 |
6.5 |
American Indian/
Alaskan Native |
21.6 |
6.8 |
12.3 |
3.9 |
| Hispanic |
15.9 |
9.1 |
9.6 |
5.1 |
| Source: Ries LAG, Harkins D, Krapcho M, Mariotto A, Miller BA, Feuer EJ, Clegg L, Eisner MP, Horner MJ, Howlader N, Hayat M, Hankey BF, Edwards BK (eds). SEER Cancer Statistics Review, 1975-2003, National Cancer Institute. Bethesda, MD, http://seer.cancer.gov/csr/1975_2003/, based on November 2005 SEER data submission, posted to the SEER web site 2006. |
|
 1
1