Per Pupil Expenditures
(CCD, 1998-1999) |
$6,828 |
Number of districts
(CCD, 1999-2000) |
197 |
Number of public schools
(CCD, 1999-2000)
| Elementary |
Middle |
High |
Combined |
Total |
| 746 |
218 |
223 |
42 |
1,277 |
Number of charter schools
(CCD, 1999-2000) |
1 |
Number of FTE teachers
(CCD, 1999-2000)
| Elementary |
Middle |
High |
Combined |
Total |
| 12,925 |
5,791 |
7,965 |
520 |
27,401 |
Public school enrollment
| |
1993-94 |
1999-2000 |
K-8
(CCD) |
365,488 |
378,752 |
9-12
(CCD) |
147,819 |
165,738 |
Total
(CCD) |
516,611 |
548,075 |
Pre-K
(by state definition) |
837 |
611 |
Sources of funding
District average
(CCD, 1998-99)

 Top Top
Race/ethnicity
(CCD, K-12)
| |
1993-94 |
1999-2000 |
| American Indian/Alaskan Natives |
9,819 |
11,388 |
| |
2% |
2% |
| Asian/Pacific Islander |
16,137 |
20,607 |
| |
3% |
4% |
| Black |
12,630 |
15,062 |
| |
2% |
3% |
| Hispanic |
30,244 |
51,546 |
| |
6% |
9% |
| White |
477,781 |
446,472 |
| |
87% |
82% |
| Other |
n/a |
n/a |
| |
— |
— |
Students with disabilities
(OSEP)
| 1993-94 |
1999-2000 |
| 54,754 |
64,191 |
| 10% |
11% |
Students with Limited English Proficiency
(ED/NCBE, K-12)
| 1993-94 |
1999-2000 |
| 19,651 |
43,845 |
| 4% |
8% |
Migratory students
(OME, K-12)
| 1993-94 |
1999-2000 |
| 23,958 |
n/a |
| 5% |
— |
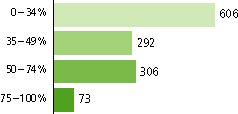
All schools by percent of students eligible to participate in the Free Lunch Program*
(CCD, 1999-2000)
Top
|
Statewide Goal for Schools on State Assessment
School performance over 60 on 125 point index (tests, attendance, dropout rates)
Expected School Improvement on Assessment
Improvement on index over 3 years (Improving=3.3 points)
Indicators for School Accountability
CRT (Reading, Math) scores, attendance, dropout
Title I Adequate Yearly Progress (AYP) for Schools
Annual Increase in percent students meeting standards in Language Arts and Math
|
Top
Title I
(ED Consolidated Report, 1999-2000)
| |
School Wide Programs |
Targeted Assistance |
Totals |
| Number of Schools |
158 |
360 |
518 |
| |
31% |
69% |
100% |
| Schools Meeting AYP Goal |
150 |
359 |
509 |
| |
95% |
100% |
98% |
| School in Need of Improvement |
5 |
4 |
9 |
| |
3% |
1% |
2% |
Title I allocation
(Includes Basic, Concentration, and LEA grants, Capital Expenditures, Even Start, Migrant Education, and Neglected & Delinquent, ED, 1999-00) |
$84,749,657 |
Top
NAEP State Results
| |
Grade 4 |
Grade 8 |
| Reading, 1998: |
|
| Proficient level and above |
28% |
33% |
| Basic level and above |
61% |
78% |
| Math, 2000: |
|
| Proficient level and above |
24% |
32% |
| Basic level and above |
68% |
72% |
Top
Assessment Information
| Assessment Reported |
Oregon Statewide Assessment System |
| State Definition of "Proficient" |
Meets or exceeds standard |
|---|
Top
Percentage of students meeting state proficiency levels
Elementary School
Grade 3
Reading/Language Arts
| |
|
|
|
|
|
Proficient |
 |
| |
Very Low |
Low |
Nearly Meets |
| |
Meets |
Exceeds |
| All Students |
12% |
7% |
8% |
| |
35% |
38% |
| Title I Schools |
14 |
8 |
9 |
| |
36 |
33 |
| High Poverty Schools |
13 |
8 |
10 |
| |
37 |
33 |
| |
|
|
|
|
| |
|
|
| Students with Limited English Proficiency |
9 |
31 |
23 |
| |
30 |
7 |
| Migratory Students |
8 |
31 |
23 |
| |
33 |
6 |
| Students with Disabilities |
25 |
11 |
12 |
| |
30 |
22 |
Mathematics
| |
|
|
|
|
|
Proficient |
|
| |
Very Low |
Low |
Nearly Meets |
| |
Meets |
Exceeds |
| All Students |
8% |
13% |
15% |
| |
38% |
27% |
| Title I Schools |
10 |
15 |
16 |
| |
37 |
22 |
| High Poverty Schools |
5 |
18 |
19 |
| |
1 |
17 |
| |
|
|
|
|
| |
|
|
| Students with Limited English Proficiency |
8 |
31 |
28 |
| |
30 |
7 |
| Migratory Students |
15 |
13 |
16 |
| |
44 |
12 |
| Students with Disabilities |
7 |
25 |
20 |
| |
35 |
13 |
Middle School
Grade 8
Reading/Language Arts
| |
|
|
|
|
|
Proficient |
|
| |
Very Low |
Low |
Nearly Meets |
| |
Meets |
Exceeds |
| All Students |
9% |
19% |
21% |
| |
24% |
27% |
| Title I Schools |
11 |
23 |
22 |
| |
23 |
21 |
| High Poverty Schools |
4 |
27 |
24 |
| |
27 |
18 |
| |
|
|
|
|
| |
|
|
| Students with Limited English Proficiency |
33 |
38 |
13 |
| |
11 |
5 |
| Migratory Students |
29 |
41 |
15 |
| |
10 |
5 |
| Students with Disabilities |
12 |
41 |
23 |
| |
15 |
9 |
Mathematics
| |
|
|
|
|
|
Proficient |
|
| |
Very Low |
Low |
Nearly Meets |
| |
Meets |
Exceeds |
| All Students |
13% |
20% |
19% |
| |
23% |
25% |
| Title I Schools |
15 |
24 |
20 |
| |
22 |
18 |
| High Poverty Schools |
17 |
31 |
19 |
| |
20 |
14 |
| |
|
|
|
|
| |
|
|
| Students with Limited English Proficiency |
33 |
38 |
13 |
| |
11 |
5 |
| Migratory Students |
2 |
4 |
33 |
| |
18 |
6 |
| Students with Disabilities |
30 |
35 |
16 |
| |
12 |
7 |
High School
Grade 10
Mathematics
| |
|
|
|
|
|
Proficient |
|
| |
Very Low |
Low |
Nearly Meets |
| |
Meets |
Exceeds |
| All Students |
13% |
19% |
23% |
| |
30% |
15% |
| Title I Schools |
18 |
23 |
24 |
| |
25 |
11 |
| High Poverty Schools |
4 |
35 |
26 |
| |
28 |
6 |
| |
|
|
|
|
| |
|
|
| Students with Limited English Proficiency |
30 |
38 |
21 |
| |
7 |
4 |
| Migratory Students |
25 |
45 |
21 |
| |
6 |
3 |
| Students with Disabilities |
10 |
52 |
24 |
| |
12 |
2 |
Mathematics
| |
|
|
|
|
|
Proficient |
|
| |
Very Low |
Low |
Nearly Meets |
| |
Meets |
Exceeds |
| All Students |
19% |
23% |
27% |
| |
21% |
11% |
| Title I Schools |
26 |
26 |
24 |
| |
17 |
7 |
| High Poverty Schools |
17 |
37 |
28 |
| |
15 |
3 |
| |
|
|
|
|
| |
|
|
| Students with Limited English Proficiency |
30 |
39 |
21 |
| |
6 |
4 |
| Migratory Students |
1 |
44 |
28 |
| |
20 |
7 |
| Students with Disabilities |
32 |
42 |
20 |
| |
5 |
2 |
High School Indicators
| |
1993-94 |
1998-99 |
High school dropout rate
(CCD, event) |
7% |
7% |
| |
1994-95 |
1998-99 |
Postsecondary enrollment
(IPEDS, High school grads enrolled in college) |
16,103 |
14,442 |
| 61% |
52% |
Sources
 [Oklahoma] | [Pennsylvania] [Oklahoma] | [Pennsylvania] 
|