|
|
 |
How To... - Read A Data Table - Prevalence Tables
Health Indicators by Demographic Variables
Use
Use the Health Indicator by Demographic Variables tables to determine
if the prevalence of a health indicator differs by age, race/ethnicity, or
education groups. These tables provide age-specific,
race/ethnicity-specific, and education-specific prevalence for a health
indicator and can be used to compare across populations and to identify
health problems or improvements in health indicators in a subpopulation.
PedNSS Health Indicator by Demographic Variables tables include:
- Table 8, Growth and Anemia Indicators by Race/Ethnicity and Age
- Table 9, Breastfeeding, TV Viewing, and Smoking in Household by
Race/Ethnicity
- Table 16, Growth Indicators by Race/Ethnicity and Age
- Table 17, Anemia Indicators by Race/Ethnicity and Age
PNSS Health Indicator by Demographic Variables tables include:
- Table 9, Maternal Health Indicators by Race/Ethnicity, Age, or
Education
- Table 10, Maternal Behavioral Indicators by Race/Ethnicity, Age, or
Education
- Table 11, Smoking Indicators by Race/Ethnicity, Age, or Education
- Table 12, Infant Health Indicators by Race/Ethnicity, Age, or
Education
These tables can be used to answer questions such as:
- What subpopulations of women or children have the highest prevalence
of a specific health indicator?
Interpreting the Data
The following paragraphs provide general information about the table
data that will help you with interpretation.
Title
For PedNSS, the table titles show the health indicators that are analyzed in
the table.
For PNSS, the table title includes a group of health indicators but only
selected health indicators are included in the group.
Review the
PNSS table titles.
Stratification of Data or Subpopulations
In these tables, the population is broken down (or stratified) into
specific subpopulations or categories. Prevalence is then calculated for
each subpopulation.
In the PedNSS tables, the health indicators are stratified by the
demographic variables of age or race/ethnicity as well as by age groups
within race/ethnicity categories:
- Age groups are stratified within race/ethnicity categories to
determine which age groups within specific categories are more likely to
be short stature, underweight, overweight, and anemic.
- Breastfeeding data are stratified by race/ethnicity to determine
which racial/ethnic groups are least likely to have been ever breastfed
or to have been breastfed at least 6 months.
In the PNSS tables, the health indicators are stratified by mother’s
education as well as age or race/ethnicity.
Sample Tables
Sample: PedNSS Table 8C, Health Indicator by
Demographic Variables
We're going to look at sections of the PedNSS Table 8C, Health Indicator
by Demographic Variables. You can click on the View
Sample Table link below each portion to review the entire table. The sample
table is numbered to match the portions shown below.
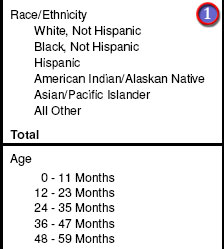
Stratification by Race/Ethnicity or Age
 |
Low
and High Birthweight, Short Stature, Underweight,
Overweight, (children) >2 Years (of age) Overweight (85th
to <95th and >95th ) and Anemia data
are stratified by either race/ethnicity or age or both. |
Review the definition of
Growth Indicators and
its prevalence calculation.
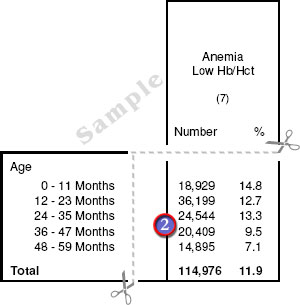
Example
 |
The Anemia prevalence (%) for 2-year-old
children (24-35 months) is 13.3%. This age group has 24,544 records
with valid hemoglobin or hematocrit data. |
Review the definition of
Anemia and
its prevalence calculation.
Sample: PedNSS Table 16C, Growth and Anemia Indicators by Race/Ethnicity and Age
We're going to look at sections of the PedNSS Table 16C, Growth and
Anemia Indicators by Race/Ethnicity and Age. You can click on the View
Sample Table link below each portion to review the entire table. The sample
table is numbered to match the portions shown below.
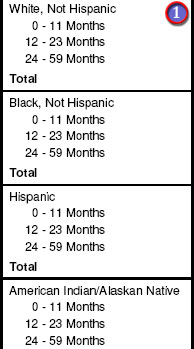
Stratification by Race/Ethnicity and Age
|
|
Short Stature, Underweight,
Overweight, (children) >2 Years (of age) Overweight
data
are stratified by age within specific race/ethnicity categories. |
Review the definition of
Growth Indicators and
its prevalence calculation.
Review the definition of Anemia and its prevalence calculation.
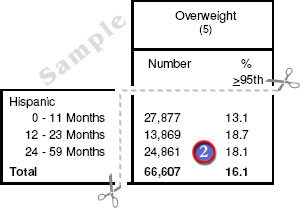
Example
|
|
The prevalence of Overweight (greater than or
equal to 95th) among Hispanic children older than or equal
to 2 years of age (24–59 Months) is 18.1%. There are 24.861 records
with valid height and weight data for Hispanic children older than or
equal to 2 years of age. |
Review the definition of
Growth Indicators and
its prevalence calculation.
back to top
|
|